


세계의 건설용 골재 시장은 2024년 4,447억 달러로 평가되었고, CAGR 6.1%로 성장할 전망이며, 2034년에는 7,963억 달러에 이를 것으로 추정되고 있습니다. 급속한 도시화, 인프라 프로젝트에 대한 투자 증가, 주택 및 상업 건축의 일관된 급증이 쇄석, 모래, 자갈과 같은 기간 자재의 왕성한 수요를 견인하고 있습니다. 세계의 정부가 보다 스마트한 도시 건설과 노후화된 인프라 업그레이드에 주력하면서 비용 대비 효과가 높고 신뢰성이 높은 건설용 골재에 대한 수요가 가속화되고 있습니다. 이와 병행하여 민간 분야는 산업 및 상업 확장에 적극적으로 나서고 있으며 수요는 더욱 확대되고 있습니다. 신흥 경제국들은 도시 마스터 플랜, 교통 기관 업그레이드, 주택 개발 등을 주요 원동력으로 삼아 인프라 변혁기를 맞고 있습니다. 이러한 동향은, 제조업체 및 공급업체에게 풍부한 성장 기회를 가져오고 있습니다. 인구가 증가하고 도시가 확대됨에 따라 총 소비량은 꾸준히 증가할 것으로 예상됩니다. 건설사들은 어려운 환경에서도 성능을 발휘할 수 있는 내구성과 확장성 있는 재료를 중시하고 있어 골재는 현대 건설에 필수적인 것이 되고 있습니다.

재료 유형별로 보면 천연 골재는 2024년에 2,890억 달러로 평가되었으며, 2034년에는 5,080억 달러에 이를 것으로 예상되고 있습니다. 천연에 풍부하게 존재하고, 가혹한 건설 환경에서도 장기간에 걸쳐 성능을 발휘하는 것으로부터, 건설업자나 개발업자에게 있어서 바람직한 선택사항이 되고 있습니다. 자연석, 모래, 조약돌과 같은 재료는 구조적 무결성과 비용 효율을 제공하고 도로와 다리에서 주택의 기초에 이르기까지의 프로젝트에 이상적입니다. 다목적 복합시설, 공공 인프라 사업, 대량 수송 프로젝트의 증가가 수요를 끌어올리고 있으며, 특히 도시 개발 이니셔티브와 장기 인프라 예산이 진행 중인 고성장 지역의 수요를 끌어올리고 있습니다.
| 시장 범위 | |
|---|---|
| 시작 연도 | 2024년 |
| 예측 연도 | 2025-2034년 |
| 시작 금액 | 4,447억 달러 |
| 예측 금액 | 7,963억 달러 |
| CAGR | 6.1% |
간접 유통 분야의 2024년 시장 규모는 2,596억 달러로 평가되었고, 2025-2034년 예측 기간 동안 CAGR 5.8%를 보일 것으로 예측됩니다. 건설 도급업체나 개발사는 조달 물류를 관리하고 지속적인 자재 흐름을 확보하는 도매상이나 유통 파트너를 통해 일하는 경우가 많습니다. 이들 중개업자는 특히 벌크 자재에 대한 부단한 접근이 중요한 지역에서 중규모에서 대규모 프로젝트의 타임라인과 자원 계획의 최적화를 지원합니다. 세계의 건설 활동이 보다 복잡해지고 기한에 쫓기게 되는 가운데, 간접 유통은, 업무 효율과 전략적 조달 양쪽 모두를 서포트하는, 바람직한 채널로 계속 되고 있습니다.
미국의 건설용 골재 시장은 2024년에 792억 달러에 달했으며, 2034년까지 연평균 복합 성장률(CAGR) 6.4%로 성장할 전망입니다. 새로운 주택 개발, 산업 지역 및 상업용 부동산의 높은 수요가 이 기세에 박차를 가하고 있습니다. 고도의 수송망과 근대적 채석 방법이 공급망의 성능을 더욱 높입니다. 재생 골재와 환경을 배려한 건축 관행으로의 시프트의 고조도 미국 시장을 형성하고 있으며, 이는 지속 가능성과 진화하는 환경 규제에의 컴플리언스에 대한 소비자 수요의 고조를 반영하고 있습니다.
건설용 골재 산업의 주요 기업는 Heidelberg, Martin Marietta, CEMEX, Knife River, Vulcan, Holcim, Greenstone Materials, CRH, Rogers, Breedon Group, Adbri, Votorantim Cimentos, Aggregate Industries, Granite Construction, and Summit 등이 있습니다. 주요 기업은 전략적 인수, 지리적 확대, 현지 건설업자와의 제휴에 주력하고 있습니다. 자동 채굴 장치와 지속 가능한 기술에 대한 투자는 친환경 제품 제공의 혁신과 함께 증가 추세에 있습니다. 이러한 움직임은 대기업이 시장에서의 존재감을 강화하고 경쟁력을 유지하는 데 도움이 되고 있습니다.
The Global Construction Aggregates Market was valued at USD 444.7 billion in 2024 and is estimated to grow at a CAGR of 6.1% to reach USD 796.3 billion by 2034. Rapid urbanization, rising investment in infrastructure projects, and a consistent surge in both residential and commercial construction are driving robust demand for core materials like crushed stone, sand, and gravel. As governments around the world focus on building smarter cities and upgrading aging infrastructure, the need for cost-effective and reliable construction aggregates is accelerating. In parallel, the private sector is actively engaging in industrial and commercial expansions, further adding to the demand pool. Emerging economies are undergoing an infrastructure transformation, largely fueled by urban master plans, transportation upgrades, and housing developments. These trends are creating abundant growth opportunities for manufacturers and suppliers. As populations grow and cities expand, aggregate consumption is expected to rise steadily. Construction companies are emphasizing durable, scalable materials that can perform under tough environmental conditions, making aggregates an indispensable part of modern construction.
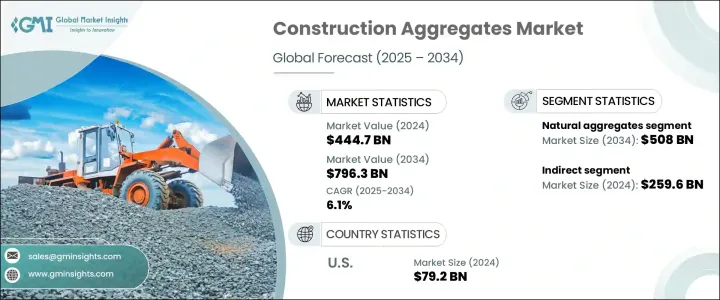
Based on material type, natural aggregates were valued at USD 289 billion in 2024 and are expected to reach USD 508 billion by 2034. Their natural abundance and long-standing performance in harsh construction environments make them the preferred option for builders and developers. Materials such as natural stone, sand, and pebbles offer structural integrity and cost-efficiency, making them ideal for projects ranging from roads and bridges to residential foundations. The rising number of multi-use complexes, public infrastructure ventures, and mass transit projects is pushing demand upward-particularly in high-growth regions with ongoing urban development initiatives and long-term infrastructure budgets.
| Market Scope | |
|---|---|
| Start Year | 2024 |
| Forecast Year | 2025-2034 |
| Start Value | $444.7 Billion |
| Forecast Value | $796.3 Billion |
| CAGR | 6.1% |
The indirect distribution segment was valued at USD 259.6 billion in 2024 and is projected to grow at a CAGR of 5.8% during the forecast period from 2025 to 2034. Construction contractors and development firms often work through wholesalers and distribution partners who manage procurement logistics and ensure continuous material flow. These intermediaries help optimize timelines and resource planning for medium to large-scale projects, especially in regions where uninterrupted access to bulk materials is critical. As global construction activity becomes more complex and deadline-driven, indirect distribution continues to be a preferred channel, supporting both operational efficiency and strategic sourcing.
The U.S. Construction Aggregates Market reached USD 79.2 billion in 2024 and will grow at a CAGR of 6.4% through 2034. High demand from new housing developments, industrial zones, and commercial real estate is fueling this momentum. Advanced transport networks and modern quarrying methods further enhance supply chain performance. A growing shift toward recycled aggregates and green building practices is also shaping the U.S. market, reflecting increasing consumer demand for sustainability and compliance with evolving environmental regulations.
Major Construction Aggregates Industry players include Heidelberg, Martin Marietta, CEMEX, Knife River, Vulcan, Holcim, Greenstone Materials, CRH, Rogers, Breedon Group, Adbri, Votorantim Cimentos, Aggregate Industries, Granite Construction, and Summit. Leading companies are focusing on strategic acquisitions, geographic expansion, and partnerships with local builders. Investment in automated mining equipment and sustainable technologies is on the rise, along with innovation in eco-friendly product offerings. These moves help major players strengthen market presence and stay competitive.