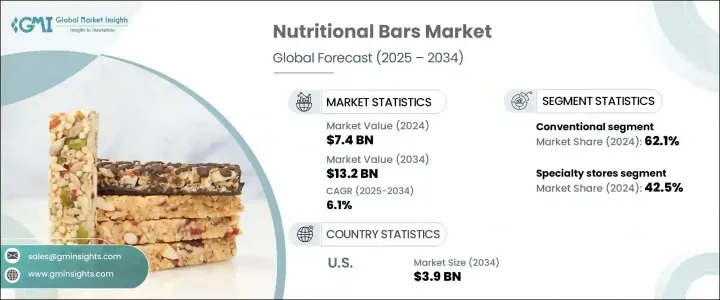
¿µ¾ç¹Ù ½ÃÀå ±Ô¸ð : Ä«Å×°í¸®º°, Á¦Ç° À¯Çüº°, À¯Åë ä³Îº°, ¼¼°è ¿¹Ãø(2023-2032³â)
Nutritional Bars Market Size - By Category (Gluten-free, Conventional), By Product Type (Cereal/Granola Bars, Protein Bars, Energy Bars/ Meal Replacements Bars, Fruits & Nuts Bars), Distribution Channel & Global Forecast, 2023-2032
»óǰÄÚµå
:
1311824
¸®¼Ä¡»ç
:
Global Market Insights Inc.
¹ßÇàÀÏ
:
2023³â 05¿ù
ÆäÀÌÁö Á¤º¸
:
¿µ¹® 250 Pages
¶óÀ̼±½º & °¡°Ý (ºÎ°¡¼¼ º°µµ)
¤± Add-on °¡´É: °í°´ÀÇ ¿äû¿¡ µû¶ó ÀÏÁ¤ÇÑ ¹üÀ§ ³»¿¡¼ CustomizationÀÌ °¡´ÉÇÕ´Ï´Ù. ÀÚ¼¼ÇÑ »çÇ×Àº ¹®ÀÇÇØ Áֽñ⠹ٶø´Ï´Ù.
¼¼°èÀÇ ¿µ¾ç¹Ù ½ÃÀåÀº 2023-2032³â °·ÂÇÑ ¼ºÀå¼¼¸¦ º¸ÀÏ °ÍÀ¸·Î ¿¹»óµË´Ï´Ù.
¼ÒºñÀÚµéÀÇ °Ç°¿¡ ´ëÇÑ ÀνÄÀÌ ³ô¾ÆÁö°í À̵¿ Áß¿¡µµ °£ÆíÇÏ°Ô ¸ÔÀ» ¼ö ÀÖ´Â °Ç°ÇÑ °£½Ä ¿É¼Ç¿¡ ´ëÇÑ ¼ö¿ä°¡ Áõ°¡ÇÔ¿¡ µû¶ó ÇâÈÄ 10³â°£ ¿µ¾ç¹ÙÀÇ ÆÇ¸Å°¡ Áõ°¡ÇÒ °ÍÀ¸·Î ¿¹»óµË´Ï´Ù. ±ÕÇü ÀâÈù ½Ä½À°üÀÇ Á߿伺°ú ¿µ¾ç ºÎÁ·À» ÇØ°áÇØ¾ß ÇÑ´Ù´Â ÀνÄÀÌ ³ô¾ÆÁü¿¡ µû¶ó ¿µ¾ç º¸ÃæÁ¦·Î¼ ¹ÙÀÇ Ã¤ÅÃÀÌ °¡¼Óȵǰí ÀÖ½À´Ï´Ù. ¶ÇÇÑ ÇÇÆ®´Ï½º Æ®·»µå Áõ°¡¿Í Ȱµ¿ÀûÀÎ ¶óÀÌÇÁ½ºÅ¸ÀÏÀÇ ±Þ¼ÓÇÑ È®»êÀº ¿îµ¿¼±¼ö¿Í ÇÇÆ®´Ï½º ¾ÖÈ£°¡¸¦ À§ÇÑ ´Ü¹éÁú ¹× ¿¡³ÊÁö °ø±Þ¿øÀ¸·Î¼ ¿µ¾ç¹ÙÀÇ ¸Å·ÂÀ» ³ôÀ̰í ÀÖ½À´Ï´Ù.
µû¶ó¼ ÀÌ ºÐ¾ß¿¡¼ »ç¾÷À» ¿î¿µÇÏ´Â ±â¾÷Àº ¸Å·ÂÀûÀÎ ÆÐŰÁö¿Í ÇÔ²² Çõ½ÅÀûÀÎ ¸À, À¯±â³ó, ±Û·çÅÙ ÇÁ¸® ¿É¼ÇÀ» µµÀÔÇϱâ À§ÇÑ ³ë·ÂÀ» °ÈÇÏ¿© È®´ëµÇ´Â ¸ñÇ¥ ½ÃÀå¿¡ ´ëÀÀÇϰí ÀÖ½À´Ï´Ù. ¿¹¸¦ µé¾î 2023³â 7¿ù ½Ã³ÊÁö Ç÷¹À̹ö(Synergy Flavors)´Â ½ºÆ÷Ã÷ ¿µ¾ç °ø±ÞÀ» È®´ëÇϰí, È®´ëµÇ´Â ½ºÆ÷Ã÷ ¿µ¾ç¹Ù ½ÃÀå¿¡¼ Çõ½ÅÀ» ÁÖµµÇÏ´Â Á¦Á¶¾÷ü¸¦ °ø·«Çϱâ À§ÇØ ´Ù¾çÇÑ ¿µÇâ ÀÖ´Â ³óÃà ¸ÀÀÇ ´Ü¹éÁú ¹Ù¸¦ Ãâ½ÃÇß½À´Ï´Ù. »õ·Î¿î Á¦Ç°À» µµÀÔÇϰųª ±âÁ¸ Á¦Ç°À» °³¼±ÇϰíÀÚ ÇÏ´Â Á¦Á¶¾÷ü¸¦ ´ë»óÀ¸·Î ÇÕ´Ï´Ù.
Àüü ¿µ¾ç¹Ù ½ÃÀåÀº Á¦Ç°, À¯Åë ä³Î ¹× Áö¿ªº°·Î ºÐ·ùµË´Ï´Ù.
Á¦Ç° Ãø¸é¿¡¼ ½Ã¸®¾ó/±×·¡³î¶ó ¹ÙÀÇ »ê¾÷ ±Ô¸ð´Â 2023-2032³â ÀνÄÇÒ ¼ö ÀÖ´Â CAGR·Î È®´ëµÉ ¼ö ÀÖ½À´Ï´Ù. Æí¸®ÇÏ°í °Ç°ÇÑ °£½Ä ¿É¼Ç¿¡ ´ëÇÑ ¼ÒºñÀÚÀÇ ¼±È£µµ°¡ ³ô¾ÆÁü¿¡ µû¶ó ½Ã¸®¾ó/±×·¡³î¶ó ¹Ù ¼ö¿ä´Â Áõ°¡ÇÏ´Â Ãß¼¼ÀÔ´Ï´Ù. ÀÌ ¹Ù´Â ¼¶À¯Áú, ºñŸ¹Î, ¹Ì³×¶öÀ» Æ÷ÇÔÇÑ Çʼö ¿µ¾ç¼Ò¸¦ °ø±ÞÇÏ¸é¼ ¹Ù»Û ¶óÀÌÇÁ½ºÅ¸ÀÏ¿¡ ºü¸£°Ô ÈÞ´ëÇÒ ¼ö ÀÖ´Â ¼Ö·ç¼ÇÀ» Á¦°øÇÕ´Ï´Ù. ¶ÇÇÑ ´Ù¾çÇÑ ¸À°ú Á¦ÇüÀ¸·Î Ãâ½ÃµÇ¾î ´Ù¾çÇÑ ÃëÇâ°ú ½Ä½À°üÀ» ÃæÁ·½Ãų ¼ö ÀÖ´Ù´Â Á¡µµ ±× Àα⸦ ´õ¿í ³ôÀ̰í ÀÖ½À´Ï´Ù.
À¯Åë ä³ÎÀÇ °æ¿ì, 2023-2032³â ¿Â¶óÀÎ ¼Ò¸Å ºÎ¹®ÀÇ ¿µ¾ç¹Ù ½ÃÀå Á¡À¯À²ÀÌ Å©°Ô Áõ°¡ÇÒ °ÍÀ¸·Î ¿¹»óµË´Ï´Ù. ¿Â¶óÀÎ À¯ÅëÀº ¼ÒºñÀÚ¿¡°Ô Æí¸®ÇÔÀ» Á¦°øÇϰí, Áý¿¡ ÀÖÀ¸¸é¼ Á¦Ç°À» ±¸¸ÅÇÒ ¼ö ÀÖ´Â ±âȸ¸¦ Á¦°øÇÕ´Ï´Ù. ÀÌ·¯ÇÑ Ç÷§ÆûÀº ´Ù¾çÇÑ ÃëÇâ¿¡ ¸Â´Â ´Ù¾çÇÑ ºê·£µå¿Í ¸ÀÀ» Á¦°øÇÏ´Â ´Ù¾çÇÑ Á¦Ç°À» Á¦°øÇÕ´Ï´Ù. ¶ÇÇÑ ¿Â¶óÀÎÀ» ÅëÇØ °¡°Ý ºñ±³, Á¦Ç° Á¤º¸ ¹× ¸®ºä¸¦ ½±°Ô È®ÀÎÇÒ ¼ö ÀÖÀ¸¸ç, Àü¹ÝÀûÀÎ ¼îÇÎ °æÇèÀ» Çâ»ó½ÃÄÑ ¿µ¾ç¹Ù¸¦ ã´Â ¼ÒºñÀÚ¿¡°Ô ¼±È£µÇ´Â ¼±ÅÃÀÌ µÉ ¼ö ÀÖ½À´Ï´Ù.
À¯·´ÀÇ ¿µ¾ç¹Ù »ê¾÷Àº 2032³â±îÁö ³ôÀº ¼ºÀå·üÀ» ±â·ÏÇÒ °ÍÀ¸·Î º¸ÀÔ´Ï´Ù. ¼ÒºñÀÚµéÀº ¿µ¾ç°¡¸¦ ÀÒÁö ¾ÊÀ¸¸é¼µµ Æí¸®ÇÔÀ» Á¦°øÇÏ´Â °Ç°ÇÑ °£½Ä ´ë¾ÈÀ» Àû±ØÀûÀ¸·Î ã°í ÀÖ½À´Ï´Ù. ¶ÇÇÑ À¯·´ °¢±¹¿¡¼ ¿ÜÃâÀÌ ÀæÀº ¶óÀÌÇÁ½ºÅ¸Àϰú ÇÇÆ®´Ï½º¿¡ ´ëÇÑ °ü½ÉÀÌ ³ô¾ÆÁö¸é¼ ¿µ¾ç¹ÙÀÇ Àαâ´Â ´õ¿í ³ô¾ÆÁö°í ÀÖ½À´Ï´Ù.
¸ñÂ÷
Á¦1Àå Á¶»ç ¹æ¹ý°ú Á¶»ç ¹üÀ§
Á¦2Àå ÁÖ¿ä ¿ä¾à
Á¦3Àå ¿µ¾ç¹Ù ¾÷°è ÀλçÀÌÆ®
- COVID-19ÀÇ ¼¼°è °æÁ¦¿¡ ´ëÇÑ ¿µÇâ
- ¿¡ÄڽýºÅÛ ºÐ¼®
- º¥´õ¡¤¸ÅÆ®¸¯½º
- À¯Åë ä³Î ºÐ¼®
- ÀÌÀÍ·ü ºÐ¼®
- ±ÔÁ¦ »óȲ
- ¿øÀç·á ºÐ¼®
- °¡°Ý ºÐ¼®
- ¾÷°è¿¡ ´ëÇÑ ¿µÇâ¿äÀÎ
- ÃËÁø¿äÀÎ
- ¼ÒºñÀÚ »çÀÌ¿¡¼ °Ç°ÁöÇâÀÇ Áõ°¡
- ÀÏ»ó ½Ä»ýȰ¿¡¼ ´Ü¹éÁú ±â¹Ý ½º³¼ÀÇ Ã¤Åà Ȯ´ë
- ¾÷°èÀÇ ÀáÀçÀû ¸®½ºÅ© & °úÁ¦
- ±â¼ú Çõ½Å°ú Áö¼Ó°¡´É¼º
- ¼ºÀå °¡´É¼º ºÐ¼®, 2022³â
- PorterÀÇ »ê¾÷ ºÐ¼®
- PESTEL ºÐ¼®
- ¿µ¾ç¹Ù ½ÃÀå¿¡ ´ëÇÑ COVID-19ÀÇ ¿µÇâ
- ·¯½Ã¾Æ¡¤¿ìÅ©¶óÀ̳ª ÀüÀïÀÌ ¿µ¾ç¹Ù ½ÃÀå¿¡ ¹ÌÄ¡´Â ¿µÇâ
Á¦4Àå °æÀï ±¸µµ, 2022³â
- ¼·Ð
- ½ÃÀå Á¡À¯À² ºÐ¼® : Áö¿ªº°, 2022³â,
- ÁÖ¿ä ½ÃÀå ±â¾÷ÀÇ °æÀï ºÐ¼®
- °æÀï Æ÷Áö¼Å´× ¸ÅÆ®¸¯½º
- Àü·« Àü¸Á ¸ÅÆ®¸¯½º
Á¦5Àå ¿µ¾ç¹Ù ½ÃÀå : Á¦Ç°º°
- ÁÖ¿ä µ¿Çâ : Á¦Ç°º°
- ½Ã¸®¾ó/±×·¡³î¶ó ¹Ù
- ÇÁ·Îƾ¹Ù
- ¿¡³ÊÁö¹Ù/½Ä»ç ´ë¿ë ¹Ù
- °úÀÏ & °ß°ú·ù ¹Ù
- ±âŸ
Á¦6Àå ¿µ¾ç¹Ù ½ÃÀå : Ä«Å×°í¸®º°
- ÁÖ¿ä µ¿Çâ : Ä«Å×°í¸®º°
- ¹«±Û·çÅÙ
- ÄÁº¥¼Å³Î(conventional)
Á¦7Àå ¿µ¾ç¹Ù ½ÃÀå : À¯Åë ä³Îº°
- ÁÖ¿ä µ¿Çâ : À¯Åë ä³Îº°
- ÇÏÀÌÆÛ¸¶ÄÏ/½´ÆÛ¸¶ÄÏ
- Àü¹®Á¡
- ¿Â¶óÀÎ ¼Ò¸Å
- ±âŸ
Á¦8Àå ¿µ¾ç¹Ù ½ÃÀå : Áö¿ªº°
- ÁÖ¿ä µ¿Çâ : Áö¿ªº°
- ºÏ¹Ì
- À¯·´
- ÇÁ¶û½º
- µ¶ÀÏ
- ÀÌÅ»¸®¾Æ
- ·¯½Ã¾Æ
- ¿µ±¹
- ½ºÆäÀÎ
- ¾Æ½Ã¾ÆÅÂÆò¾ç
- ¶óƾ¾Æ¸Þ¸®Ä«
- Áßµ¿ & ¾ÆÇÁ¸®Ä«
- ³²¾ÆÇÁ¸®Ä«°øÈ±¹
- »ç¿ìµð¾Æ¶óºñ¾Æ
- ¾Æ¶ø¿¡¹Ì¸®Æ®
Á¦9Àå ±â¾÷ °³¿ä
- General Mills, Inc.
- Ajinomoto Co., Inc.
- Cargill Incorporated
- Mondelez International
- Glanbia Plc
- HEALTHY BARS
- ADM
- Global Nutrition International
- The Simply Good Foods Company
- The Kellogg Company
KSA
¿µ¹® ¸ñÂ÷
Global Nutritional Bars Market is poised for robust growth over 2023-2032.
Rising health consciousness among consumers and a greater demand for convenient, on-the-go, and healthy snacking options will stimulate nutritional bar sales over the next ten years. The increasing awareness of the importance of balanced diets and the need to address nutritional gaps has spurred the uptake of these bars as a viable dietary supplement. Moreover, the growing fitness trend and rapid adoption of active lifestyles have boosted the appeal of nutritional bars as a source of protein and energy for athletes and fitness enthusiasts.
To that end, companies operating in this space are leveling-up their efforts to introduce innovative flavors, organic and gluten-free options with attractive packaging to address the expanding target market. For instance, in July 2023, to broaden its sports nutrition offering and target manufacturers innovating in the expanding sports nutrition bar market, Synergy Flavours introduced a variety of high-impact, concentrated flavors of protein bars. The line, which includes eight new flavors, is aimed at manufacturers who want to introduce new products or improve existing ones.
The overall nutritional bars market is categorized based on product, distribution channel, and region.
Regarding the product, the cereal/granola bars industry size could expand at a recognizable CAGR between 2023 and 2032. The demand for cereal/granola bars is on the rise due to the increasing preference for convenient and healthy snacking options among consumers. These bars offer a quick and portable solution for busy lifestyles while providing essential nutrients, including fiber, vitamins, and minerals. Additionally, the availability of various flavors and formulations caters to diverse tastes and dietary preferences, further driving their popularity.
With respect to distribution channel, the nutritional bars market share from the online retail segment will grow significantly over 2023-2032. Online distribution offers consumers convenience, enabling them to purchase products from the comfort of their homes. These platforms provide a vast selection of brands and flavors, catering to diverse preferences. Besides, the ease of comparing prices, accessing product information, and reading reviews online enhances the overall shopping experience, making it a favored option for consumers seeking nutritional bars.
Europe nutritional bars industry value will register appreciable growth through 2032, primarily due to the region's increasing health and wellness consciousness. Consumers are actively seeking healthier snacking alternatives that provide convenience without compromising nutritional value. Additionally, the rising trend of on-the-go lifestyles and fitness-oriented habits has further fueled the popularity of nutritional bars across European countries.
Table of Contents
Chapter 1 Methodology & Scope
- 1.1 Market definitions
- 1.2 Base estimates & working
- 1.3 Forecast calculations
- 1.3.1 COVID-19 impact parameters
- 1.3.1.1 North America
- 1.3.1.2 Europe
- 1.3.1.3 Asia Pacific
- 1.3.1.4 Latin America (LATAM)
- 1.3.1.5 Middle East & Africa
- 1.4 Data sources
- 1.4.1 Primary
- 1.4.2 Secondary
- 1.4.2.1 Paid Sources
- 1.4.2.2 Public Sources
Chapter 2 Executive Summary
- 2.1 Nutritional bars market industry 360 degree synopsis, 2018 - 2032
- 2.1.1 Business trends
- 2.1.2 Regional trends
- 2.1.3 Product trends
- 2.1.4 Category trends
- 2.1.5 Distribution channel trends
Chapter 3 Nutritional Bars Industry Insights
- 3.1 COVID-19 impact on world economy
- 3.2 Industry ecosystem analysis
- 3.2.1 Vendor matrix
- 3.2.2 Distribution channel analysis
- 3.2.3 Profit margin analysis
- 3.3 Regulatory Landscape
- 3.3.1.1 U.S.
- 3.3.1.2 Europe
- 3.3.1.3 China
- 3.4 Raw material analysis
- 3.5 Pricing analysis
- 3.5.1 Regional pricing analysis, by product
- 3.5.1.1 North America
- 3.5.1.2 Europe
- 3.5.1.3 Asia Pacific
- 3.5.1.4 Latin America
- 3.5.1.5 Middle East & Africa
- 3.6 Industry impact forces
- 3.6.1 Growth drivers
- 3.6.1.1 Increasing health consciousness among consumers.
- 3.6.1.2 Growing adoption of protein-based snacks in daily diet
- 3.6.2 Industry pitfalls & challenges
- 3.6.2.1 Availability of substitutes
- 3.7 Innovation and sustainability
- 3.8 Growth potential analysis, 2022
- 3.9 Porter's analysis
- 3.10 PESTEL analysis
- 3.11 COVID-19 impact on market Nutritional bars market
- 3.12 Russia-Ukraine war impact on Nutritional bars market
Chapter 4 Competitive Landscape, 2022
- 4.1 Introduction
- 4.2 Market share analysis, by region, 2022
- 4.2.1 North America
- 4.2.2 Europe
- 4.2.3 Asia Pacific
- 4.2.4 Latin America
- 4.2.5 Middle East & Africa
- 4.3 Competitive analysis of major market players
- 4.4 Competitive positioning matrix
- 4.5 Strategic outlook matrix
Chapter 5 Nutritional Bars Market By Product
- 5.1 Key product trends
- 5.2 Cereal/Granola Bars
- 5.2.1 Global market estimates and forecasts, 2018 - 2032
- 5.2.2 Global market estimates and forecasts, by region, 2018 - 2032
- 5.3 Protein Bars
- 5.3.1 Global market estimates and forecasts, 2018 - 2032
- 5.3.2 Global market estimates and forecasts, by region, 2018 - 2032
- 5.4 Energy Bars/ Meal Replacements Bars
- 5.4.1 Global market estimates and forecasts, 2018 - 2032
- 5.4.2 Global market estimates and forecasts, by region, 2018 - 2032
- 5.5 Fruits & Nuts Bars
- 5.5.1 Global market estimates and forecasts, 2018 - 2032
- 5.5.2 Global market estimates and forecasts, by region, 2018 - 2032
- 5.6 Others
- 5.6.1 Global market estimates and forecasts, 2018 - 2032
- 5.6.2 Global market estimates and forecasts, by region, 2018 - 2032
Chapter 6 Nutritional bars Market By Category
- 6.1 Key category trends
- 6.2 Gluten-free
- 6.2.1 Global market estimates and forecasts, 2018 - 2032
- 6.2.2 Global market estimates and forecasts, by region, 2018 - 2032
- 6.3 Conventional
- 6.3.1 Global market estimates and forecasts, 2018 - 2032
- 6.3.2 Global market estimates and forecasts, by region, 2018 - 2032
Chapter 7 Nutritional bars Market By Distribution Channel
- 7.1 Key distribution channel trends
- 7.2 Hypermarkets/Supermarkets
- 7.2.1 Global market estimates and forecasts, 2018 - 2032
- 7.2.2 Global market estimates and forecasts, by region, 2018 - 2032
- 7.3 Specialty Stores
- 7.3.1 Global market estimates and forecasts, 2018 - 2032
- 7.3.2 Global market estimates and forecasts, by region, 2018 - 2032
- 7.4 Online Retail
- 7.4.1 Global market estimates and forecasts, 2018 - 2032
- 7.4.2 Global market estimates and forecasts, by region, 2018 - 2032
- 7.5 Others
- 7.5.1 Global market estimates and forecasts, 2018 - 2032
- 7.5.2 Global market estimates and forecasts, by region, 2018 - 2032
Chapter 8 Nutritional bars Market, By Region
- 8.1 Key region trends
- 8.2 North America
- 8.2.1 Market estimate and forecast, 2018-2032
- 8.2.2 Market estimates and forecast, by product, 2018-2032
- 8.2.3 Market estimates and forecast, by category, 2018 - 2032
- 8.2.4 Market estimates and forecast, by distribution channel, 2018 - 2032
- 8.2.5 U.S.
- 8.2.5.1 Market estimate and forecast, 2018-2032
- 8.2.5.2 Market estimates and forecast, by product, 2018-2032
- 8.2.5.3 Market estimates and forecast, by category, 2018 - 2032
- 8.2.5.4 Market estimates and forecast, by distribution channel, 2018 - 2032
- 8.2.6 Canada
- 8.2.6.1 Market estimate and forecast, 2018-2032
- 8.2.6.2 Market estimates and forecast, by product, 2018-2032
- 8.2.6.3 Market estimates and forecast, by category, 2018 - 2032
- 8.2.6.4 Market estimates and forecast, by distribution channel, 2018 - 2032
- 8.3 Europe
- 8.3.1 Market estimate and forecast, 2018-2032
- 8.3.2 Market estimates and forecast, by product, 2018-2032
- 8.3.3 Market estimates and forecast, by category, 2018 - 2032
- 8.3.4 Market estimates and forecast, by distribution channel, 2018 - 2032
- 8.3.5 France
- 8.3.5.1 Market estimate and forecast, 2018-2032
- 8.3.5.2 Market estimates and forecast, by product, 2018-2032
- 8.3.5.3 Market estimates and forecast, by category, 2018 - 2032
- 8.3.5.4 Market estimates and forecast, by distribution channel, 2018 - 2032
- 8.3.6 Germany
- 8.3.6.1 Market estimate and forecast, 2018-2032
- 8.3.6.2 Market estimates and forecast, by product, 2018-2032
- 8.3.6.3 Market estimates and forecast, by category, 2018 - 2032
- 8.3.6.4 Market estimates and forecast, by distribution channel, 2018 - 2032
- 8.3.7 Italy
- 8.3.7.1 Market estimate and forecast, 2018-2032
- 8.3.7.2 Market estimates and forecast, by product, 2018-2032
- 8.3.7.3 Market estimates and forecast, by category, 2018 - 2032
- 8.3.7.4 Market estimates and forecast, by distribution channel, 2018 - 2032
- 8.3.8 Russia
- 8.3.8.1 Market estimate and forecast, 2018-2032
- 8.3.8.2 Market estimates and forecast, by product, 2018-2032
- 8.3.8.3 Market estimates and forecast, by category, 2018 - 2032
- 8.3.8.4 Market estimates and forecast, by distribution channel, 2018 - 2032
- 8.3.9 UK
- 8.3.9.1 Market estimate and forecast, 2018-2032
- 8.3.9.2 Market estimates and forecast, by product, 2018-2032
- 8.3.9.3 Market estimates and forecast, by category, 2018 - 2032
- 8.3.9.4 Market estimates and forecast, by distribution channel, 2018 - 2032
- 8.3.10 Spain
- 8.3.10.1 Market estimate and forecast, 2018-2032
- 8.3.10.2 Market estimates and forecast, by product, 2018-2032
- 8.3.10.3 Market estimates and forecast, by category, 2018 - 2032
- 8.3.10.4 Market estimates and forecast, by distribution channel, 2018 - 2032
- 8.4 Asia Pacific
- 8.4.1 Market estimate and forecast, 2018-2032
- 8.4.2 Market estimates and forecast, by product, 2018-2032
- 8.4.3 Market estimates and forecast, by category, 2018 - 2032
- 8.4.4 Market estimates and forecast, by distribution channel, 2018 - 2032
- 8.4.5 China
- 8.4.5.1 Market estimate and forecast, 2018-2032
- 8.4.5.2 Market estimates and forecast, by product, 2018-2032
- 8.4.5.3 Market estimates and forecast, by category, 2018 - 2032
- 8.4.5.4 Market estimates and forecast, by distribution channel, 2018 - 2032
- 8.4.6 Japan
- 8.4.6.1 Market estimate and forecast, 2018-2032
- 8.4.6.2 Market estimates and forecast, by product, 2018-2032
- 8.4.6.3 Market estimates and forecast, by category, 2018 - 2032
- 8.4.6.4 Market estimates and forecast, by distribution channel, 2018 - 2032
- 8.4.7 India
- 8.4.7.1 Market estimate and forecast, 2018-2032
- 8.4.7.2 Market estimates and forecast, by product, 2018-2032
- 8.4.7.3 Market estimates and forecast, by category, 2018 - 2032
- 8.4.7.4 Market estimates and forecast, by distribution channel, 2018 - 2032
- 8.4.8 South Korea
- 8.4.8.1 Market estimate and forecast, 2018-2032
- 8.4.8.2 Market estimates and forecast, by product, 2018-2032
- 8.4.8.3 Market estimates and forecast, by category, 2018 - 2032
- 8.4.8.4 Market estimates and forecast, by distribution channel, 2018 - 2032
- 8.5 Latin America
- 8.5.1 Market estimate and forecast, 2018-2032
- 8.5.2 Market estimates and forecast, by product, 2018-2032
- 8.5.3 Market estimates and forecast, by category, 2018 - 2032
- 8.5.4 Market estimates and forecast, by distribution channel, 2018 - 2032
- 8.5.5 Brazil
- 8.5.5.1 Market estimate and forecast, 2018-2032
- 8.5.5.2 Market estimates and forecast, by product, 2018-2032
- 8.5.5.3 Market estimates and forecast, by category, 2018 - 2032
- 8.5.5.4 Market estimates and forecast, by distribution channel, 2018 - 2032
- 8.5.6 Argentina
- 8.5.6.1 Market estimate and forecast, 2018-2032
- 8.5.6.2 Market estimates and forecast, by product, 2018-2032
- 8.5.6.3 Market estimates and forecast, by category, 2018 - 2032
- 8.5.6.4 Market estimates and forecast, by distribution channel, 2018 - 2032
- 8.5.7 Mexico
- 8.5.7.1 Market estimate and forecast, 2018-2032
- 8.5.7.2 Market estimates and forecast, by product, 2018-2032
- 8.5.7.3 Market estimates and forecast, by category, 2018 - 2032
- 8.5.7.4 Market estimates and forecast, by distribution channel, 2018 - 2032
- 8.6 Middle East & Africa
- 8.6.1 Market estimate and forecast, 2018-2032
- 8.6.2 Market estimates and forecast, by product, 2018-2032
- 8.6.3 Market estimates and forecast, by category, 2018 - 2032
- 8.6.4 Market estimates and forecast, by distribution channel, 2018 - 2032
- 8.6.5 South Africa
- 8.6.5.1 Market estimate and forecast, 2018-2032
- 8.6.5.2 Market estimates and forecast, by product, 2018-2032
- 8.6.5.3 Market estimates and forecast, by category, 2018 - 2032
- 8.6.5.4 Market estimates and forecast, by distribution channel, 2018 - 2032
- 8.6.6 Saudi Arabia
- 8.6.6.1 Market estimate and forecast, 2018-2032
- 8.6.6.2 Market estimates and forecast, by product, 2018-2032
- 8.6.6.3 Market estimates and forecast, by category, 2018 - 2032
- 8.6.6.4 Market estimates and forecast, by distribution channel, 2018 - 2032
- 8.6.7 UAE
- 8.6.7.1 Market estimate and forecast, 2018-2032
- 8.6.7.2 Market estimates and forecast, by product, 2018-2032
- 8.6.7.3 Market estimates and forecast, by category, 2018 - 2032
- 8.6.7.4 Market estimates and forecast, by distribution channel, 2018 - 2032
Chapter 9 Company Profiles
- 9.1 General Mills, Inc.
- 9.1.1 Business overview
- 9.1.2 Financial data
- 9.1.3 Product Landscape
- 9.1.4 Strategic Outlook
- 9.1.5 SWOT analysis
- 9.2 Ajinomoto Co., Inc.
- 9.2.1 Business overview
- 9.2.2 Financial data
- 9.2.3 Product Landscape
- 9.2.4 Strategic Outlook
- 9.2.5 SWOT analysis
- 9.3 Cargill Incorporated
- 9.3.1 Business overview
- 9.3.2 Financial data
- 9.3.3 Product Landscape
- 9.3.4 Strategic Outlook
- 9.3.5 SWOT analysis
- 9.4 Mondelez International
- 9.4.1 Business overview
- 9.4.2 Financial data
- 9.4.3 Product Landscape
- 9.4.4 Strategic Outlook
- 9.4.5 SWOT analysis
- 9.5 Glanbia Plc
- 9.5.1 Business overview
- 9.5.2 Financial data
- 9.5.3 Product Landscape
- 9.5.4 Strategic Outlook
- 9.5.5 SWOT analysis
- 9.6 HEALTHY BARS
- 9.6.1 Business overview
- 9.6.2 Financial data
- 9.6.3 Product Landscape
- 9.6.4 Strategic Outlook
- 9.6.5 SWOT analysis
- 9.7 ADM
- 9.7.1 Business overview
- 9.7.2 Financial data
- 9.7.3 Product Landscape
- 9.7.4 Strategic Outlook
- 9.7.5 SWOT analysis
- 9.8 Global Nutrition International
- 9.8.1 Business overview
- 9.8.2 Financial data
- 9.8.3 Product Landscape
- 9.8.4 Strategic Outlook
- 9.8.5 SWOT analysis
- 9.9 The Simply Good Foods Company
- 9.9.1 Business overview
- 9.9.2 Financial data
- 9.9.3 Product Landscape
- 9.9.4 Strategic Outlook
- 9.9.5 SWOT analysis
- 9.10 The Kellogg Company
- 9.10.1 Business overview
- 9.10.2 Financial data
- 9.10.3 Product Landscape
- 9.10.4 Strategic Outlook
- 9.10.5 SWOT analysis
°ü·ÃÀÚ·á