Television Network Market, By Service, By Revenue Model, By Geography
상품코드:1729668
리서치사:Coherent Market Insights
발행일:2025년 04월
페이지 정보:영문
라이선스 & 가격 (부가세 별도)
ㅁ Add-on 가능: 고객의 요청에 따라 일정한 범위 내에서 Customization이 가능합니다. 자세한 사항은 문의해 주시기 바랍니다.
한글목차
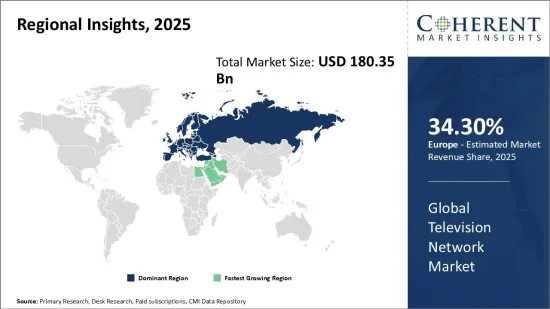
세계 TV 네트워크 시장은 2025년 1,803억 5,000만 달러로 추정되며, 2032년에는 2,765억 9,000만 달러에 달할 것으로 예상되며, 2025년부터 2032년까지 연평균 성장률(CAGR)은 6.3%로 성장할 것으로 예상됩니다.
보고서 범위
보고서 상세
기준 연도
2024년
2025년 시장 규모
1,803억 5,000만 달러
실적 데이터
2020-2024년
예측 기간
2025-2032년
예측 기간 : 2025-2032년 CAGR
6.30%
2032년 가치 예측
2,765억 9,000만 달러
그림. TV 네트워크 시장 점유율(%), 지역별, 2025년
전 세계 TV 네트워크 시장은 엔터테인먼트 및 정보 컨텐츠에 대한 수요 증가에 힘입어 지난 수십 년 동안 꾸준히 성장해 왔습니다. TV는 개인 시청자뿐만 아니라 광고주들에게도 가장 인기 있고 널리 이용되는 미디어 중 하나입니다. 전 세계 주요 방송사들은 고품질 프로그램 개발에 많은 투자를 지속하고 있으며, 다양한 플랫폼과 디바이스에 컨텐츠를 제공하기 위한 전송 인프라를 확장하고 있습니다. 기술 혁신으로 시청자들은 기존 TV 외에도 스마트폰, 태블릿, 노트북 등 원하는 화면에서 TV 생방송과 주문형 비디오를 시청할 수 있게 되었습니다. 이에 따라 미디어 소비는 전 세계적으로 확대되고 있습니다.
시장 역학:
세계 TV 네트워크 시장의 성장은 시청자들의 다양한 컨텐츠에 대한 강한 수요, 전 세계 인터넷 보급률의 증가, 스마트 커넥티드 디바이스의 등장에 의해 주도되고 있습니다. 그러나 시청자들이 기존 유료방송보다 온라인 스트리밍을 선호하는 코드커팅 경향의 증가와 디지털 미디어 플레이어와의 경쟁 심화 등의 요인이 시장을 혼란에 빠뜨릴 수 있습니다. 한편, TV 방송 사업자들은 OTT(Over The Top) 플랫폼의 존재감을 확대하고 통신 사업자와 제휴하여 통합 서비스를 제공하는 기회를 활용하고 있습니다. 인공지능, 가상현실, 블록체인과 같은 분야의 발전도 향후 TV 시청 경험을 향상시킬 수 있는 가능성을 제공하고 있습니다.
본 조사의 주요 특징
세계의 TV 네트워크 시장을 상세히 분석했으며, 2024년을 기준 연도로 하여 예측 기간(2025-2032년)의 시장 규모와 연평균 성장률(CAGR)을 조사하여 전해드립니다.
또한, 다양한 부문의 잠재적 수익 기회를 밝히고, 이 시장의 매력적인 투자 제안 매트릭스를 설명합니다.
또한 시장 촉진요인, 억제요인, 기회, 신제품 출시 및 승인, 시장 동향, 지역별 전망, 주요 기업의 경쟁 전략 등에 대한 중요한 인사이트를 제공합니다.
세계 TV 네트워크 시장의 주요 기업들을 기업 하이라이트, 제품 포트폴리오, 주요 하이라이트, 실적, 전략 등의 매개변수를 기반으로 프로파일링합니다.
이 보고서의 인사이트를 통해 마케팅 담당자와 기업 경영진은 향후 제품 출시, 유형화, 시장 확대, 마케팅 전략에 대한 정보에 입각한 의사결정을 내릴 수 있습니다.
이 보고서는 투자자, 공급업체, 제품 제조업체, 유통업체, 신규 진입자, 재무 분석가 등 업계의 다양한 이해관계자를 대상으로 합니다.
이해관계자들은 세계 TV 네트워크 시장 분석에 사용되는 다양한 전략 매트릭스를 통해 의사결정을 쉽게 내릴 수 있습니다.
목차
제1장 조사 목적과 가정
조사 목적
가정
약어
제2장 시장 전망
보고서 설명
시장 정의와 범위
주요 요약
제3장 시장 역학, 규제, 동향 분석
시장 역학
영향 분석
주요 하이라이트
규제 시나리오
제품 발매/승인
PEST 분석
PORTER의 분석
시장 기회
규제 시나리오
주요 발전
업계 동향
제4장 세계의 TV 네트워크 시장, 서비스별, 2020-2032년
직접 방송위성(DBS) 서비스
케이블 TV나 기타 유료 서비스
구독 채널 서비스
위성 마스터 안테나 시스템 서비스(SMATV)
멀티포인트 배포 시스템 서비스(MDS)
폐회로 TV(감시 카메라)
제5장 세계의 TV 네트워크 시장, 수익 모델별, 2020-2032년
구독
광고
제6장 세계의 TV 네트워크 시장, 지역별, 2020-2032년
북미
미국
캐나다
라틴아메리카
브라질
아르헨티나
멕시코
기타 라틴아메리카
유럽
독일
영국
스페인
프랑스
이탈리아
러시아
기타 유럽
아시아태평양
중국
인도
일본
호주
한국
ASEAN
기타 아시아태평양
중동
GCC 국가
이스라엘
기타 중동
아프리카
남아프리카공화국
북아프리카
중앙아프리카
제7장 경쟁 구도
Samsung Electronics
LG Display
Sony Corporation
Hisense Group
Foxconn Technology Group
Dixon Technologies
Kathrein-Werke KG
Comcast Corporation
The Walt Disney Company
Warner Bros. Discovery
Netflix Inc.
Paramount Global
Apple Inc.
AT&T Inc.
Charter Communications
제8장 애널리스트의 추천사항
Wheel of Fortune
애널리스트의 견해
Coherent Opportunity Map
제9장 참고문헌과 조사 방법
참고문헌
조사 방법
출판사 소개
ksm
영문 목차
영문목차
Global Television Network Market is estimated to be valued at USD 180.35 Bn in 2025 and is expected to reach USD 276.59 Bn by 2032, growing at a compound annual growth rate (CAGR) of 6.3% from 2025 to 2032.
Report Coverage
Report Details
Base Year:
2024
Market Size in 2025:
USD 180.35 Bn
Historical Data for:
2020 To 2024
Forecast Period:
2025 To 2032
Forecast Period 2025 to 2032 CAGR:
6.30%
2032 Value Projection:
USD 276.59 Bn
Figure. Television Network Market Share (%), By Region 2025
The global television network market has been growing steadily over the past few decades driven by rising demand for entertainment and information content. Television remains one of the most popular and widely used media for both individual viewers as well as advertisers. Major broadcasters across the world continue to invest heavily in developing high quality programming as well as expanding their distribution infrastructure to deliver content across various platforms and devices. Innovation in technology has enabled viewers to access live television and on-demand video on any screen of their choice including smartphones, tablets, and laptops besides traditional television sets. This has boosted media consumption globally.
Market Dynamics:
The global television network market growth is driven by strong demand for diversified content from viewers, growing internet penetration worldwide, and advent of smart connected devices. However, factors such as rising cord-cutting trend wherein viewers prefer online streaming over conventional pay television and increasing competition from digital media players threatens to disrupt the market. Meanwhile, television broadcasters are capitalizing on opportunities to expand their over-the-top (OTT) platform presence and partnerships with telecom operators to deliver integrated services. Advancements in areas such as artificial intelligence, virtual reality and Blockchain also offer potential to enhance television viewing experience going forward.
Key Features of the Study:
This report provides in-depth analysis of the global television network market, and provides market size (US$ Billion) and compound annual growth rate (CAGR%) for the forecast period (2025-2032), considering 2024 as the base year
It elucidates potential revenue opportunities across different segments and explains attractive investment proposition matrices for this market
This study also provides key insights about market drivers, restraints, opportunities, new product launches or approvals, market trends, regional outlook, and competitive strategies adopted by key players
It profiles key players in the global television network market based on the following parameters - company highlights, products portfolio, key highlights, financial performance, and strategies
Key companies covered as a part of this study include Samsung Electronics, LG Display, Sony Corporation, Hisense Group, Foxconn Technology Group, Dixon Technologies, Kathrein-Werke KG, Comcast Corporation, The Walt Disney Company, Warner Bros. Discovery, Netflix Inc., Paramount Global, Apple Inc., AT&T Inc., and Charter Communications
Insights from this report would allow marketers and the management authorities of the companies to make informed decisions regarding their future product launches, type up-gradation, market expansion, and marketing tactics
The global television network market report caters to various stakeholders in this industry including investors, suppliers, product manufacturers, distributors, new entrants, and financial analysts
Stakeholders would have ease in decision-making through various strategy matrices used in analyzing the global television network market
Market Segmentation
Service Insights (Revenue, USD Bn, 2020 - 2032)
Direct Broadcast Satellite (DBS) Services
Cable and Other Pay Services
Subscription Channel Services
Satellite Master Antenna Systems Services (SMATV)
Multipoint Distribution System Services (MDS)
Closed Circuit Television Circuits
Revenue Model Insights (Revenue, USD Bn, 2020 - 2032)
Subscription
Advertisement
Regional Insights (Revenue, USD Bn, 2020 - 2032)
North America
U.S.
Canada
Latin America
Brazil
Argentina
Mexico
Rest of Latin America
Europe
Germany
U.K.
Spain
France
Italy
Russia
Rest of Europe
Asia Pacific
China
India
Japan
Australia
South Korea
ASEAN
Rest of Asia Pacific
Middle East
GCC Countries
Israel
Rest of Middle East
Africa
South Africa
North Africa
Central Africa
Company Profiles:
Samsung Electronics
LG Display
Sony Corporation
Hisense Group
Foxconn Technology Group
Dixon Technologies
Kathrein-Werke KG
Comcast Corporation
The Walt Disney Company
Warner Bros. Discovery
Netflix Inc.
Paramount Global
Apple Inc.
AT&T Inc.
Charter Communications
Table of Contents
1. Research Objectives and Assumptions
Research Objectives
Assumptions
Abbreviations
2. Market Purview
Report Description
Market Definition and Scope
Executive Summary
Global Television Network Market, By Service
Global Television Network Market, By Revenue Model
Global Television Network Market, By Region
3. Market Dynamics, Regulations, and Trends Analysis
Market Dynamics
Impact Analysis
Key Highlights
Regulatory Scenario
Product Launches/Approvals
PEST Analysis
PORTER's Analysis
Market Opportunities
Regulatory Scenario
Key Developments
Industry Trends
4. Global Television Network Market, By Service, 2020-2032, (USD Bn)
Introduction
Market Share Analysis, 2025 and 2032 (%)
Y-o-Y Growth Analysis, 2021 - 2032
Segment Trends
Direct Broadcast Satellite (DBS) Services
Introduction
Market Size and Forecast, and Y-o-Y Growth, 2020-2032, (USD Bn)
Cable and Other Pay Services
Introduction
Market Size and Forecast, and Y-o-Y Growth, 2020-2032, (USD Bn)
Subscription Channel Services
Introduction
Market Size and Forecast, and Y-o-Y Growth, 2020-2032, (USD Bn)
Satellite Master Antenna Systems Services (SMATV)
Introduction
Market Size and Forecast, and Y-o-Y Growth, 2020-2032, (USD Bn)
Multipoint Distribution System Services (MDS)
Introduction
Market Size and Forecast, and Y-o-Y Growth, 2020-2032, (USD Bn)
Closed Circuit Television Circuits
Introduction
Market Size and Forecast, and Y-o-Y Growth, 2020-2032, (USD Bn)
5. Global Television Network Market, By Revenue Model, 2020-2032, (USD Bn)
Introduction
Market Share Analysis, 2025 and 2032 (%)
Y-o-Y Growth Analysis, 2021 - 2032
Segment Trends
Subscription
Introduction
Market Size and Forecast, and Y-o-Y Growth, 2020-2032, (USD Bn)
Advertisement
Introduction
Market Size and Forecast, and Y-o-Y Growth, 2020-2032, (USD Bn)
6. Global Television Network Market, By Region, 2020 - 2032, Value (USD Bn)