


PV 인버터 세계 시장 규모는 2025년에 153억 3,000만 달러, 2032년에는 425억 4,000만 달러에 달할 것으로 추정되며, 2025-2032년 동안 CAGR 15.7%로 성장할 것으로 예상됩니다.
| 보고서 범위 | 보고서 상세 | ||
|---|---|---|---|
| 기준 연도 | 2024년 | 2025년 시장 규모 | 153억 3,000만 달러 |
| 실적 데이터 | 2020-2024년 | 예측 기간 | 2025-2032년 |
| 예측 기간 : 2025-2032년 CAGR | 15.70% | 2032년 금액 예측 | 425억 4,000만 달러 |
PV 인버터는 태양전지판에서 생산된 직류(DC)를 가정 내 전기 배선 및 공공 전력망에 공급할 수 있는 교류(AC)로 변환하는 중요한 역할을 담당하고 있습니다. 인버터 설계의 기술 발전으로 효율, 신뢰성, 수명이 향상되고 있습니다. 한편, 태양전지판의 가격 하락과 재생에너지를 촉진하기 위한 정부의 다양한 인센티브 및 이니셔티브는 옥상 및 지상 설치형 태양광발전소의 대규모 설치를 촉진하고 있습니다. 이러한 태양광발전소 설치량 증가가 예측 기간 동안 PV 인버터 수요를 견인할 것으로 예상됩니다. 그러나 태양광의 간헐적인 특성과 현재 진행 중인 COVID-19 팬데믹으로 인한 공급망 혼란은 시장 성장에 일정한 도전이 될 것입니다.
시장 역학
세계 PV 인버터 시장은 환경 문제에 대한 관심 증가, 탄소 배출량 감축을 위한 재생에너지원에 대한 관심 증가, 태양광발전 설치에 대한 정부 지원 정책 및 인센티브 등의 요인에 의해 주도되고 있습니다. 예를 들어, 유럽연합(EU)은 2030년까지 총 에너지의 32% 이상을 재생에너지로 발전하는 것을 목표로 하고 있습니다. 미국에서는 2024년까지 설치된 태양광발전 시스템에 대해 30%의 세액공제를 제공하는 '태양열 투자 세액공제'를 시행하고 있습니다. 그러나 집중형 태양광발전 시스템 도입에 따른 높은 초기 투자 비용과 태양광발전의 간헐적 특성이 가동률을 제한하고 있어 시장 성장을 저해하고 있습니다. 시장에는 인공지능(AI) 기술 및 사물인터넷(IoT) 등의 기술을 활용하여 출력을 최적화하고 자가 진단 기능을 갖추고 다운타임을 줄일 수 있는 스마트 인버터를 개발할 수 있는 기회가 있습니다. 그리드 상호연결을 위한 보편적인 표준을 추진하고 경제적인 에너지 저장 솔루션을 개발함으로써 전 세계적으로 태양광 에너지의 대량 도입을 더욱 가속화할 수 있습니다.
세계의 PV 인버터 시장을 상세히 분석하여 2024년을 기준 연도로 하여 예측 기간(2025-2032년)의 시장 규모와 연평균 성장률(CAGR)을 조사 분석하여 전해드립니다.
또한, 다양한 부문의 잠재적 수익 기회를 밝히고, 이 시장의 매력적인 투자 제안 매트릭스를 설명합니다.
또한 시장 촉진요인, 억제요인, 기회, 신제품 출시 및 승인, 시장 동향, 지역별 전망, 주요 기업의 경쟁 전략 등에 대한 중요한 인사이트를 제공합니다.
PV 인버터 세계 시장의 주요 기업 프로파일을 기업 하이라이트, 제품 포트폴리오, 주요 하이라이트, 실적, 전략 등의 매개 변수를 기반으로 게재하고 있습니다.
주요 기업으로는 Eaton, Emerson Electric Co., Power Electronics S.L., Hitachi Hi-Rel Power Electronics Private Limited, Siemens Energy, Fimer Group, SMA Solar Technology AG, Delta Electronics, Inc, SunPower Corporation, Omron Corporation. 등이 있습니다.
이 보고서의 인사이트를 통해 마케팅 담당자와 기업 경영진은 향후 제품 출시, 유형화, 시장 확대, 마케팅 전술에 대한 정보에 입각한 의사결정을 내릴 수 있습니다.
PV 인버터 세계 시장 보고서는 투자자, 공급업체, 제품 제조업체, 유통업체, 신규 진입자, 재무 분석가 등 이 산업의 다양한 이해관계자를 대상으로 합니다.
이해관계자들은 세계 PV 인버터 시장 분석에 사용되는 다양한 전략 매트릭스를 통해 의사결정을 용이하게 할 수 있습니다.
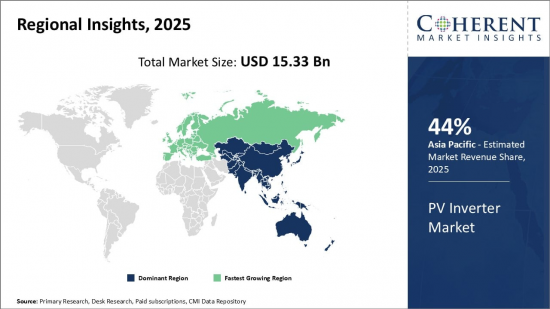
Global PV Inverter Market is estimated to be valued at USD 15.33 Bn in 2025 and is expected to reach USD 42.54 Bn by 2032, growing at a compound annual growth rate (CAGR) of 15.7% from 2025 to 2032.
| Report Coverage | Report Details | ||
|---|---|---|---|
| Base Year: | 2024 | Market Size in 2025: | USD 15.33 Bn |
| Historical Data for: | 2020 To 2024 | Forecast Period: | 2025 To 2032 |
| Forecast Period 2025 to 2032 CAGR: | 15.70% | 2032 Value Projection: | USD 42.54 Bn |

PV inverter market has been witnessing significant growth over the past few years owing to the rising adoption of solar power worldwide. Solar PV inverters play a vital role in converting the direct current (DC) produced by solar panels into alternative current (AC) that can be fed into the domestic electric wiring or public grid network. Technological advancements in inverter design have improved their efficiency, reliability, and lifespan. Meanwhile, the declining cost of solar panels, along with various government incentives and initiatives to promote renewable energy, have boosted the large-scale installation of rooftop and ground-mounted solar farms. This growing solar capacity installation is anticipated to drive the demand for PV inverters during the forecast period. However, the intermittent nature of sunlight and supply-chain disruptions due to the ongoing COVID-19 pandemic pose certain challenges for market growth.
Market Dynamic:
The global PV inverter market is driven by factors such as rising environmental concerns, an increasing focus on renewable sources of energy to reduce carbon emissions, and supportive government policies & incentives for solar PV installations. For instance, the European Union has set a target of generating at least 32% of its total energy from renewable sources by 2030. In the U.S., the Solar Investment Tax Credit provides a 30% tax credit for solar energy systems installed before 2024. However, the growth of the market is restrained by the high initial investment costs associated with deploying a centralized PV system and the intermittent nature of solar, which limits its capacity utilization. The market players have opportunities to leverage technologies like Artificial Intelligence (AI) technologies and the Internet Of Things (IOT) to develop smart inverters that can optimize output, provide self-diagnosis, and reduce downtime. Promoting universal standards for grid interconnection and developing economical energy storage solutions can further accelerate the mass adoption of solar energy globally.
This report provides in-depth analysis of the global PV inverter market, and provides market size (US$ Billion) and compound annual growth rate (CAGR%) for the forecast period (2025-2032), considering 2024 as the base year
It elucidates potential revenue opportunities across different segments and explains attractive investment proposition matrices for this market
This study also provides key insights about market drivers, restraints, opportunities, new product launches or approval, market trends, regional outlook, and competitive strategies adopted by key players
It profiles key players in the global PV inverter market based on the following parameters - company highlights, products portfolio, key highlights, financial performance, and strategies
Key companies covered as a part of this study include Eaton, Emerson Electric Co., Power Electronics S.L., Hitachi Hi-Rel Power Electronics Private Limited, Siemens Energy, Fimer Group, SMA Solar Technology AG, Delta Electronics, Inc, SunPower Corporation, Omron Corporation.
Insights from this report would allow marketers and the management authorities of the companies to make informed decisions regarding their future product launches, type up-gradation, market expansion, and marketing tactics
The global PV inverter market report caters to various stakeholders in this industry including investors, suppliers, product manufacturers, distributors, new entrants, and financial analysts
Stakeholders would have ease in decision-making through various strategy matrices used in analyzing the global PV inverter market
PV Inverter Market Segmentation:
Table Of Content