Global Naphthenic Base Oil Market, By Application, By End-use Industry, By Grade, By Geography
상품코드:1707296
리서치사:Coherent Market Insights
발행일:2025년 03월
페이지 정보:영문
라이선스 & 가격 (부가세 별도)
ㅁ Add-on 가능: 고객의 요청에 따라 일정한 범위 내에서 Customization이 가능합니다. 자세한 사항은 문의해 주시기 바랍니다.
한글목차
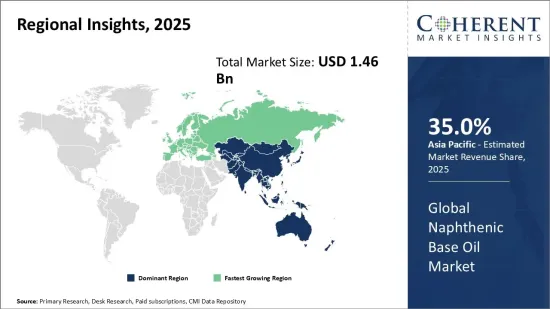
나프텐계 기유 세계 시장은 2025년에 14억 6,000만 달러로 추정되며 2032년에는 20억 1,000만 달러에 달할 것으로 예상되며 2025년부터 2032년까지 4.7%의 연평균 성장률을 보일 것으로 예상됩니다.
보고서 범위
보고서 상세
기준 연도
2024년
2025년 시장 규모
14억 6,000만 달러
실적 데이터
2020-2024년
예측 기간
2025-2032년
예측 기간 : 2025-2032년 CAGR:
4.70%
2032년 가치 예측
20억 1,000만 달러
그림. 나프텐계 기유 세계 시장 점유율(%), 지역별, 2025년
세계 나프텐계 기유 시장은 지난 10년간 페인트 및 코팅 산업의 수요 증가로 인해 크게 성장해 왔습니다. 나프텐계 기유는 감압 증류 과정에서 석유 원유에서 정제되어 높은 점도 지수, 열 안정성, 엘라스토머와의 상용성과 같은 우수한 특성을 제공합니다. 이러한 기유는 고무 컴파운드의 공정유 및 기타 블렌딩 용도의 익스텐더로 널리 사용되고 있습니다. 페인트 및 코팅 분야는 전 세계 나프텐계 기유 소비량의 30% 이상을 차지합니다. 목재 방부제, 건축용 화학제품, 접착제 제제에 대한 사용 증가도 시장 성장을 꾸준히 촉진하고 있습니다. 그러나 원유 가격의 변동은 여전히 이 분야의 시장 기업들에게 중요한 도전이 되고 있습니다.
시장 역학
세계 나프텐계 기유 시장은 페인트 및 코팅 산업의 수요 증가, 자동차 생산 증가, 공정용 오일의 최종 용도 확대 등의 요인에 의해 주도되고 있습니다. 페인트 및 코팅 용도는 우수한 특성으로 인해 전체 나프텐계 오일의 30% 이상을 사용하고 있습니다. 또한, 특히 아시아태평양의 자동차 산업 확대는 공정유 소비를 촉진하는 주요 요인으로 작용하고 있습니다. 그러나 나프텐계 오일은 정유 제품이기 때문에 원유 가격의 변동은 여전히 주요 억제요인으로 작용하고 있습니다. 원유 가격의 상승은 이러한 제조업체의 운영 비용에 직접적인 영향을 미칩니다. 그러나 최종 용도, 특히 목재 방부제, 건축 화학제품 및 접착제 제제의 용도가 증가함에 따라이 시장 플레이어에게 새로운 성장의 길을 열어주고 있습니다. 주요 기업들은 잠재적 기회를 활용하기 위해 바이오 기반 및 친환경 제품 개발을 위한 연구개발에 투자하고 있습니다.
본 조사의 주요 특징
세계의 나프텐계 기유 시장을 상세히 분석했으며, 2024년을 기준 연도로 하여 2025-2032년까지의 예측 기간 동안 시장 규모(10억 달러)와 연평균 성장률(CAGR)을 조사하여 전해드립니다.
또한, 다양한 부문에 걸친 잠재적 수익 기회를 밝히고, 이 시장의 매력적인 투자 제안 매트릭스를 설명합니다.
또한 시장 촉진요인, 억제요인, 기회, 신제품 출시 및 승인, 시장 동향, 지역별 전망, 주요 기업의 경쟁 전략 등에 대한 중요한 인사이트를 제공합니다.
세계 나프텐계 기유 시장의 주요 기업들에 대해 기업 개요, 제품 포트폴리오, 주요 특징, 실적, 전략 등의 파라미터를 기반으로 프로파일을 작성하였습니다.
주요 기업으로는 Nynas AB, Royal Dutch Shell, Calumet Specialty Products Partners, Ergon Inc., Chevron Corporation, Repsol S.A., ExxonMobil Corporation, H&R Group, Avista Oil, Petrobras, Lubricon Industries, Eastern Petroleum, Indo Petro Chemicals, Panama Petrochem Ltd., Gandhar Oil Refinery India Limited, Apar Industries Limited, HollyFrontier Corporation, Pentagon Lubricants, Witmans Industries Pvt. Ltd. 등이 있습니다.
이 보고서의 인사이트를 통해 마케팅 담당자와 기업 경영진은 향후 제품 출시, 유형 업그레이드, 시장 확대, 마케팅 전술에 대한 정보에 입각한 의사결정을 내릴 수 있습니다.
나프텐 기유 세계 시장 보고서는 투자자, 공급업체, 제품 제조업체, 유통업체, 신규 진입자, 재무 분석가 등 업계의 다양한 이해관계자를 대상으로 합니다.
이해관계자들은 세계 나프텐계 기유 시장 분석에 사용되는 다양한 전략 매트릭스를 통해 의사결정을 쉽게 내릴 수 있습니다.
목차
제1장 조사 목적과 가정
조사 목적
가정
약어
제2장 시장 전망
보고서 설명
시장 정의와 범위
주요 요약
제3장 시장 역학, 규제, 동향 분석
시장 역학
영향 분석
주요 하이라이트
규제 시나리오
제품 발매/승인
PEST 분석
PORTER의 분석
시장 기회
규제 시나리오
주요 발전
업계 동향
제4장 세계의 나프텐계 기유 시장, 용도별, 2020-2032년
변압기유
프로세스 오일
고무 프로세스 오일
윤활유
기타
제5장 세계의 나프텐계 기유 시장, 최종 이용 산업별, 2020-2032년
전기·전자
자동차
산업
석유화학
기타
제6장 세계의 나프텐계 기유 시장, 등급별, 2020-2032년
35-60 SUS
80-130 SUS
200-300SUS
400-800 SUS
1200 SUS 이상
제7장 세계의 나프텐계 기유 시장, 지역별, 2020-2032년
북미
라틴아메리카
유럽
아시아태평양
중동
아프리카
제8장 경쟁 구도
Nynas AB
Royal Dutch Shell
Calumet Specialty Products Partners
Ergon Inc.
Chevron Corporation
Repsol S.A.
ExxonMobil Corporation
H&R Group
Avista Oil
Petrobras
Lubricon Industries
Eastern Petroleum
Indo Petro Chemicals
Panama Petrochem Ltd.
Gandhar Oil Refinery India Limited
Apar Industries Limited
HollyFrontier Corporation
Pentagon Lubricants
Witmans Industries Pvt. Ltd.
제9장 애널리스트의 추천사항
Wheel of Fortune
애널리스트의 견해
일관성 있을 기회 맵
제10장 참고문헌과 조사 방법
참고문헌
조사 방법
출판사 소개
ksm
영문 목차
영문목차
Global Global Naphthenic Base Oil Market is estimated to be valued at US$ 1.46 Bn in 2025 and is expected to reach US$ 2.01 Bn by 2032, growing at a compound annual growth rate (CAGR) of 4.7% from 2025 to 2032.
Report Coverage
Report Details
Base Year:
2024
Market Size in 2025:
US$ 1.46 Bn
Historical Data for:
2020 To 2024
Forecast Period:
2025 To 2032
Forecast Period 2025 to 2032 CAGR:
4.70%
2032 Value Projection:
US$ 2.01 Bn
Figure. Global Naphthenic Base Oil Market Share (%), By Region 2025
The global naphthenic base oil market has been growing significantly over the past decade primarily due to the increasing demand from paints and coatings industry. Naphthenic base oils are refined from petroleum crude oil during vacuum distillation and offer superior properties like high viscosity index, thermal stability, and compatibility with elastomers. These base oils are widely used as process oils in rubber compounding and as extenders in other blending applications. The paints and coatings sector accounts for over 30% of total naphthenic base oil consumption globally. Rising applications in wood preservatives, construction chemicals, and adhesive formulations have also been boosting the market growth steadily. However, volatility in crude oil prices remains a key challenge for market players in this space.
Market Dynamics
The global naphthenic base oil market is driven by factors such as increasing demand from paints and coatings industry, rising automotive production, and growing end-use applications of process oils. Paints and coatings application utilizes over 30% of total naphthenic oils due to their superior properties. Additionally, expansion of automotive industry especially in Asia Pacific has been a major driver of process oils consumption. However, fluctuating crude oil prices remain a key restraint, as naphthenic oils are refined petroleum products. Higher crude prices directly impact the operating costs for these manufacturers. But rising end-use applications especially in wood preservatives, construction chemicals, and adhesive formulations are opening new growth avenues for players in this market. Major companies are investing in R&D to develop bio-based and environment-friendly variants to leverage potential opportunities.
Key Features of the Study
This report provides in-depth analysis of the global naphthenic base oil market, and provides market size (USD Bn) and compound annual growth rate (CAGR%) for the forecast period 2025-2032, considering 2024 as the base year
It elucidates potential revenue opportunities across different segments and explains attractive investment proposition matrices for this market
This study also provides key insights about market drivers, restraints, opportunities, new product launches or approvals, market trends, regional outlook, and competitive strategies adopted by key players
It profiles key players in the global naphthenic base oil market based on the following parameters - company highlights, products portfolio, key highlights, financial performance, and strategies
Key companies covered as a part of this study include Nynas AB, Royal Dutch Shell, Calumet Specialty Products Partners, Ergon Inc., Chevron Corporation, Repsol S.A., ExxonMobil Corporation, H&R Group, Avista Oil, Petrobras, Lubricon Industries, Eastern Petroleum, Indo Petro Chemicals, Panama Petrochem Ltd., Gandhar Oil Refinery India Limited, Apar Industries Limited, HollyFrontier Corporation, Pentagon Lubricants, and Witmans Industries Pvt. Ltd.
Insights from this report would allow marketers and the management authorities of the companies to make informed decisions regarding their future product launches, type up-gradation, market expansion, and marketing tactics
The global naphthenic base oil market report caters to various stakeholders in this industry including investors, suppliers, product manufacturers, distributors, new entrants, and financial analysts
Stakeholders would have ease in decision-making through various strategy matrices used in analyzing the global naphthenic base oil market