Environmental Technology Market, By Component, By Application, By End User, By Geography
상품코드:1705703
리서치사:Coherent Market Insights
발행일:2025년 02월
페이지 정보:영문
라이선스 & 가격 (부가세 별도)
ㅁ Add-on 가능: 고객의 요청에 따라 일정한 범위 내에서 Customization이 가능합니다. 자세한 사항은 문의해 주시기 바랍니다.
한글목차
세계의 환경 기술 시장은 2025년 7,147억 4,000만 달러로 추정되고, 2032년까지 1조 542억 9,000만 달러에 이를 것으로 예측되고, 2025년부터 2032년까지 CAGR 5.7%로 추이할 것으로 예측되고 있습니다.
보고 범위
보고서 세부정보
기준연도
2024년
2025년 시장 규모
7,147억 4,000만 달러
실적 데이터
2020-2024년
예측 기간
2025-2032년
예측 기간: 2025-2032년 CAGR:
5.70%
2032년 가치 예측
1조542억 9,000만 달러
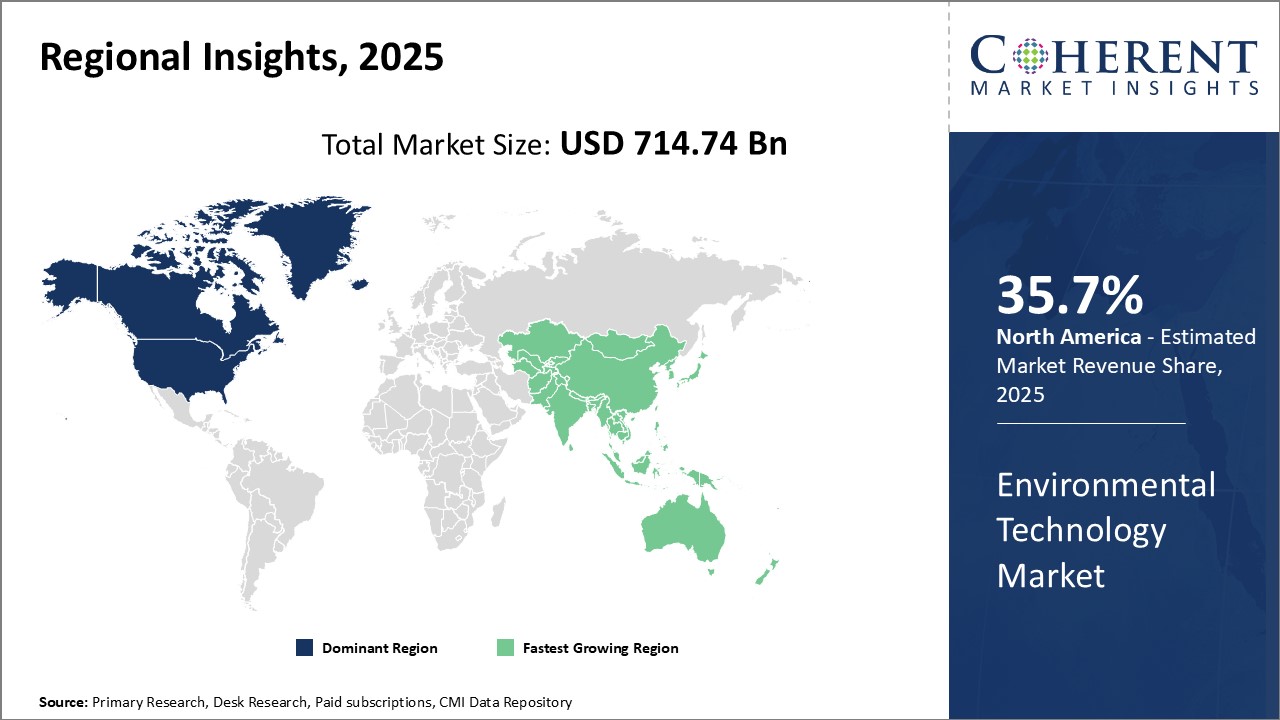
그림. 환경기술시장의 지역별 점유율(%)(2025년)
세계의 환경 기술 시장의 성장은 기후 변화에 대한 우려 증가와 탄소 배출량 증가가 원동력이 되고 있습니다. 지속가능성에 대한 의식이 높아짐에 따라 많은 정부와 조직이 환경보호 대책을 채용하기 위한 보조금이나 장려금을 제공합니다.
시장 역학:
세계 환경 기술 시장의 성장은 주로 탄소 배출, 수질 오염 방지, 폐기물 관리에 관한 엄격한 정부 규제에 의해 초래됩니다. 하지만 특히 신흥국의 소규모 기업이나 지자체에게는 초기 비용이 높은 것이 시장 개척의 방해가 될 수 있습니다. 표준화의 부족은 호환성 문제를 일으킬 수 있습니다.
본 조사의 주요 특징
본 보고서에서는 세계의 환경기술 시장을 상세하게 분석하여 2024년을 기준연도로 한 예측기간(2025-2032년) 시장 규모 및 복합연간 성장률(CAGR%)을 제공합니다.
또, 다양한 부문에 걸친 잠재적인 수익 기회를 해명해, 이 시장의 매력적인 투자 제안 매트릭스에 대해서 해설했습니다.
또한 시장 성장 촉진요인, 억제요인, 기회, 신제품 발매 및 승인, 시장 동향, 지역별 전망, 주요 기업이 채용하는 경쟁 전략 등에 관한 주요 고찰도 제공합니다.
기업 하이라이트, 제품 포트폴리오, 주요 하이라이트, 재무 실적, 전략 등의 파라미터에 근거해, 세계의 환경 기술 시장의 주요 기업을 프로파일 하고 있습니다.
본 보고서로부터의 인사이트에 의해 마케팅 담당자나 기업의 경영진은 장래의 제품 발매, 유형 업, 시장 확대, 마케팅 전술에 관한 정보에 근거한 의사 결정을 실시할 수 있습니다.
세계 환경 기술 시장 보고서는 투자자, 공급업체, 제품 제조업체, 유통 업체, 신규 참가자, 재무 분석가 등이 업계의 다양한 이해 관계자를 대상으로 합니다.
이해관계자는 세계의 환경기술 시장 분석에 사용되는 다양한 전략 매트릭스를 통해 의사결정이 용이해집니다.
목차
제1장 조사의 목적과 전제조건
조사 목적
전제조건
약어
제2장 시장 전망
보고서 설명
시장 정의와 범위
주요 요약
Coherent Opportunity Map(COM)
제3장 시장 역학, 규제, 동향 분석
시장 역학
성장 촉진요인
억제요인
시장 기회
규제 시나리오
업계 동향
합병과 인수
신시스템 출시/승인
COVID-19 팬데믹의 영향
제4장 세계의 환경 기술 시장, 컴포넌트별, 2020-2032년
솔루션
서비스
수도 서비스
폐기물 관리 서비스
에너지 서비스
산업 서비스
제5장 세계의 환경 기술 시장, 용도별, 2020-2032년
발전과 연료
고형 폐수 처리
오염 감시
폐수 처리
수질 정화 관리
하수 처리
정밀 냉각
가스용해
기타
제6장 세계의 환경 기술 시장, 최종 사용자별, 2020-2032년
주택 및 시영
산업
에너지 및 유틸리티
운송 및 물류
석유 및 가스
식음료
건설자재
소매 및 소비재
정부
기타
제7장 세계의 환경 기술 시장, 지역별, 2020-2032년
북미
유럽
아시아태평양
라틴아메리카
중동 및 아프리카
제8장 경쟁 구도
기업 프로파일
AECOM
Abetment Technologies
Biffa ltd
CarbonCure Technologies Inc.
Covanta Holding Corporation
Ecolab Inc.
ENGIE Impact
HDR, Inc.
IDEX Corporation
Lennox International
Teledyne Technologies Incorporated
Thermo Fisher Scientific Inc.
Veolia
Waste Connections
Xylem
제9장 분석가 추천
운명의 원
애널리스트의 견해
일관성 있는 기회 맵
제10장 조사 방법
참고문헌
조사 방법
JHS
영문 목차
영문목차
Global Environmental Technology Market is estimated to be valued at USD 714.74 Bn in 2025 and is expected to reach USD 1,054.29 Bn by 2032, growing at a compound annual growth rate (CAGR) of 5.7% from 2025 to 2032.
Report Coverage
Report Details
Base Year:
2024
Market Size in 2025:
USD 714.74 Bn
Historical Data for:
2020 To 2024
Forecast Period:
2025 To 2032
Forecast Period 2025 to 2032 CAGR:
5.70%
2032 Value Projection:
USD 1,054.29 Bn
Figure. Environmental Technology Market Share (%), By Region 2025
Global environmental technology market growth is driven by increasing climate change concerns and rising carbon emissions. Environmental technologies include water treatment systems, renewable energy installations, waste management solutions, and pollution reduction equipment. These provide eco-friendly alternatives for various industries and help minimize negative human impact on the natural ecosystem. With growing awareness about sustainability, many governments and organizations offer subsidies and incentives for adopting environment-protection measures. Emerging economies are also investing heavily in green infrastructure to ensure clean air and water for their citizens. The worldwide push for a low-carbon economy can offer opportunities for the market growth and boost demand for environmental technologies in the near future.
Market Dynamics:
Global environmental technology market growth is primarily driven by stringent government regulations regarding carbon emissions, water pollution control, and waste management. Major factors like the Paris Agreement, renewable energy targets, and zero-emission vehicle mandates have accelerated the deployment of green technologies. However, high initial costs, especially for small enterprises and municipalities in developing nations can hamper the market growth. Lack of standardization can create compatibility issues. Falling prices of renewable power generation systems and supportive policies in many countries can help to overcome financial barriers. Growing industrialization and urbanization have heightened pollution levels that boosts demand for environmental remediation services.
Key features of the study:
This report provides in-depth analysis of the global environmental technology market, and provides market size (US$ Bn) and compound annual growth rate (CAGR%) for the forecast period (2025-2032), considering 2024 as the base year.
It elucidates potential revenue opportunities across different segments and explains attractive investment proposition matrices for this market.
This study also provides key insights about market drivers, restraints, opportunities, new product launches or approval, market trends, regional outlook, and competitive strategies adopted by key players.
It profiles key players in the global environmental technology market based on the following parameters - company highlights, products portfolio, key highlights, financial performance, and strategies.
Key companies covered as a part of this study include AECOM, Abetment Technologies, Biffa ltd, CarbonCure Technologies Inc., Covanta Holding Corporation, Ecolab Inc., ENGIE Impact, HDR, Inc., IDEX Corporation, Lennox International, Teledyne Technologies Incorporated, Thermo Fisher Scientific Inc., Veolia, Waste Connections, Xylem.
Insights from this report would allow marketers and the management authorities of the companies to make informed decisions regarding their future product launches, type up-gradation, market expansion, and marketing tactics.
Global environmental technology market report caters to various stakeholders in this industry including investors, suppliers, product manufacturers, distributors, new entrants, and financial analysts.
Stakeholders would have ease in decision-making through various strategy matrices used in analyzing the global environmental technology market.
Detailed Segmentation:
By Component
Solution
Services
Water Services
Waste Management Services
Energy Services
Industrial Services
By Application
Power Generation & Fuel
Solid Waste Treatment
Pollution Monitoring
Wastewater Treatment
Water Purification Management
Sewage Treatment
Precision Cooling
Gas Dissolution
Others
By End User
Residential/Municipal
Industrial
Energy & Utilities
Transportation & Logistics
Oil & gas
Food & Beverages
Construction & Building Materials
Retail & Consumer goods
Government
Others
By Regional
North America
Europe
Asia Pacific
Latin America
Middle East & Africa
Key Players Insights
AECOM
Abetment Technologies
Biffa ltd
CarbonCure Technologies Inc.
Covanta Holding Corporation
Ecolab Inc.
ENGIE Impact
HDR, Inc.
IDEX Corporation
Lennox International
Teledyne Technologies Incorporated
Thermo Fisher Scientific Inc.
Veolia
Waste Connections
Xylem
Table of Contents
1. Research Objectives and Assumptions
Research Objectives
Assumptions
Abbreviations
2. Market Purview
Report Description
Market Definition and Scope
Executive Summary
Market Snippet, By Component
Market Snippet, By Application
Market Snippet, By End User
Market Snippet, By Region
Coherent Opportunity Map (COM)
3. Market Dynamics, Regulations, and Trends Analysis
Market Dynamics
Drivers
Restraints
Market Opportunities
Regulatory Scenario
Industry Trend
Merger and Acquisitions
New System Launches/Approvals
Impact of COVID-19 Pandemic
4. Global Environmental Technology Market, By Component, 2020-2032, (US$ Bn)
Introduction
Market Share Analysis, 2025 and 2032 (%)
Y-o-Y Growth Analysis, 2020-2032
Segment Trends
Solution
Introduction
Market Size and Forecast, 2020-2032, (US$ Bn)
Services
Introduction
Market Size and Forecast, 2020-2032, (US$ Bn)
Water Services
Waste Management Services
Energy Services
Industrial Services
5. Global Environmental Technology Market, By Application, 2020-2032, (US$ Bn)
Introduction
Market Share Analysis, 2025 and 2032 (%)
Y-o-Y Growth Analysis, 2020-2032
Segment Trends
Power Generation & Fuel
Introduction
Market Size and Forecast, 2020-2032, (US$ Bn)
Solid Waste Treatment
Introduction
Market Size and Forecast, 2020-2032, (US$ Bn)
Pollution Monitoring
Introduction
Market Size and Forecast, 2020-2032, (US$ Bn)
Wastewater Treatment
Introduction
Market Size and Forecast, 2020-2032, (US$ Bn)
Water Purification Management
Introduction
Market Size and Forecast, 2020-2032, (US$ Bn)
Sewage Treatment
Introduction
Market Size and Forecast, 2020-2032, (US$ Bn)
Precision Cooling
Introduction
Market Size and Forecast, 2020-2032, (US$ Bn)
Gas Dissolution
Introduction
Market Size and Forecast, 2020-2032, (US$ Bn)
Others
Introduction
Market Size and Forecast, 2020-2032, (US$ Bn)
6. Global Environmental Technology Market, By End User, 2020-2032, (US$ Bn)
Introduction
Market Share Analysis, 2025 and 2032 (%)
Y-o-Y Growth Analysis, 2020-2032
Segment Trends
Residential/Municipal
Introduction
Market Size and Forecast, 2020-2032, (US$ Bn)
Industrial
Introduction
Market Size and Forecast, 2020-2032, (US$ Bn)
Energy & Utilities
Introduction
Market Size and Forecast, 2020-2032, (US$ Bn)
Transportation & Logistics
Introduction
Market Size and Forecast, 2020-2032, (US$ Bn)
Oil & gas
Introduction
Market Size and Forecast, 2020-2032, (US$ Bn)
Food & Beverages
Introduction
Market Size and Forecast, 2020-2032, (US$ Bn)
Construction & Building Materials
Introduction
Market Size and Forecast, 2020-2032, (US$ Bn)
Retail & Consumer goods
Introduction
Market Size and Forecast, 2020-2032, (US$ Bn)
Government
Introduction
Market Size and Forecast, 2020-2032, (US$ Bn)
Others
Introduction
Market Size and Forecast, 2020-2032, (US$ Bn)
7. Global Environmental Technology Market, By Region, 2020-2032, (US$ Bn)
Introduction
Market Share Analysis, By Region, 2025 and 2032 (%)
Y-o-Y Growth Analysis, 2020-2032
North America
Regional Trends
Market Size and Forecast, By Component, 2020-2032, (US$ Bn)
Market Size and Forecast, By Application, 2020-2032, (US$ Bn)
Market Size and Forecast, By End User, 2020-2032, (US$ Bn)
Market Size and Forecast, By Country, 2020-2032, (US$ Bn)
U.S.
Canada
Europe
Regional Trends
Market Size and Forecast, By Component, 2020-2032, (US$ Bn)
Market Size and Forecast, By Application, 2020-2032, (US$ Bn)
Market Size and Forecast, By End User, 2020-2032, (US$ Bn)
Market Size and Forecast, By Country, 2020-2032, (US$ Bn)
U.K.
Germany
France
Russia
Rest of Europe
Asia Pacific
Regional Trends
Market Size and Forecast, By Component, 2020-2032, (US$ Bn)
Market Size and Forecast, By Application, 2020-2032, (US$ Bn)
Market Size and Forecast, By End User, 2020-2032, (US$ Bn)
Market Size and Forecast, By Country, 2020-2032, (US$ Bn)
China
India
Japan
ASEAN
Australia
South Korea
Rest of Asia Pacific
Latin America
Regional Trends
Market Size and Forecast, By Component, 2020-2032, (US$ Bn)
Market Size and Forecast, By Application, 2020-2032, (US$ Bn)
Market Size and Forecast, By End User, 2020-2032, (US$ Bn)
Market Size and Forecast, By Country, 2020-2032, (US$ Bn)
Brazil
Argentina
Mexico
Rest of Latin America
Middle East & Africa
Regional Trends
Market Size and Forecast, By Component, 2020-2032, (US$ Bn)
Market Size and Forecast, By Application, 2020-2032, (US$ Bn)
Market Size and Forecast, By End User, 2020-2032, (US$ Bn)
Market Size and Forecast, By Country, 2020-2032, (US$ Bn)