Healthcare Payer Services Market, By Service Type, By Application, By End User, By Geography
상품코드:1705676
리서치사:Coherent Market Insights
발행일:2025년 02월
페이지 정보:영문
라이선스 & 가격 (부가세 별도)
ㅁ Add-on 가능: 고객의 요청에 따라 일정한 범위 내에서 Customization이 가능합니다. 자세한 사항은 문의해 주시기 바랍니다.
한글목차
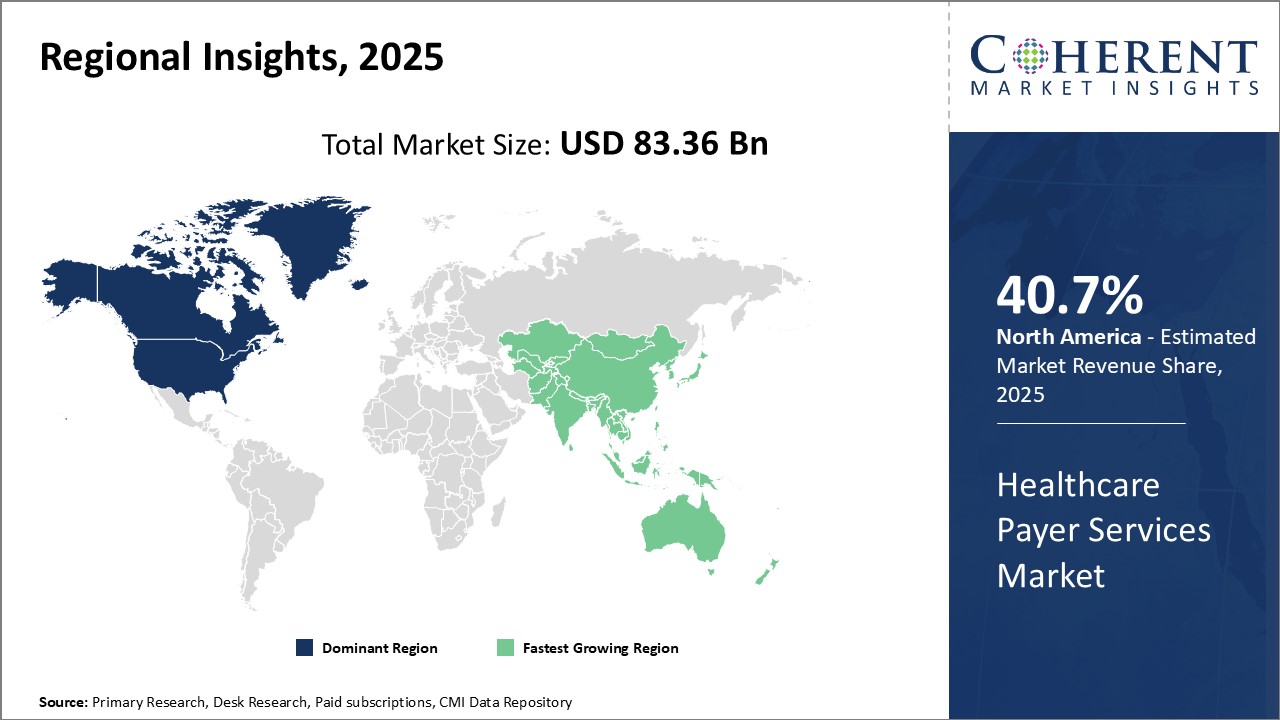
세계 의료비 지불자 서비스 시장은 2025년 833억 6,000만 달러로 추정되며, 2032년에는 1,584억 5,000만 달러에 달할 것으로 예상되며, 2025년부터 2032년까지 연평균 9.6%의 성장률을 보일 것으로 예상됩니다.
보고서 범위
보고서 상세
기준 연도
2024년
2025년 시장 규모
833억 6,000만 달러
실적 데이터
2020-2024년
예측 기간
2025-2032년
예측 기간 : 2025-2032년 CAGR
9.60
2032년 가치 예측
1,584억 5,000만 달러
그림. 의료비 지불자 서비스 시장 점유율(%), 지역별, 2025년
세계 의료비 지불자 서비스 시장의 성장은 의료비 지불자와 공급자가 수익 주기 운영의 전반적인 효율성 개선에 점점 더 집중하고 있는 데에 기인합니다. 의료비 지불자는 경쟁 우위를 확보하기 위해 고객 서비스 향상과 고객 참여 제공에 중점을 두고 있습니다. 또한, 의료보험제도 이용 증가와 의료비 본인 부담 증가로 인해 효율적인 지불 서비스에 대한 수요가 증가하고 있습니다. 다양한 서비스 제공업체들은 지불자가 변화하는 수익 흐름을 관리하고, 청구 처리를 최적화하며, 관리 워크플로우를 간소화하고, 비용을 절감할 수 있도록 첨단 솔루션을 개발 및 배포하고 있습니다.
시장 역학:
의료비 상승 억제와 수익성 향상에 대한 관심이 높아지면서 세계 의료비 지불자 서비스 시장의 성장을 주도하고 있습니다. 지불자는 비용 절감을 위해 비핵심 업무를 제3자 기관(TPA) 및 기타 서비스 제공업체에 아웃소싱하는 경향이 증가하고 있습니다. 또한, 의료보험을 필요로 하는 노인 인구의 증가와 함께 만성질환이 급증하면서 효율적인 청구 처리 및 관리에 대한 요구가 증가하고 있습니다. 그러나 민감한 환자 데이터 처리와 관련된 보안 문제, 레거시 시스템과 새로운 솔루션과의 통합의 어려움은 시장 성장을 저해하는 요인으로 작용할 수 있습니다. 클라우드 기반 플랫폼의 사용 증가와 인공지능과 같은 첨단 기술의 출현은 가까운 장래에 시장 기업들에게 유리한 기회를 제공할 수 있습니다.
본 조사의 주요 특징
세계의 의료비 지불자 서비스 시장을 상세히 분석했으며, 2024년을 기준 연도로 하여 예측 기간(2025-2032년)의 시장 규모(10억 달러)와 연평균 성장률(CAGR)을 조사하여 전해드립니다.
또한, 다양한 부문에 걸친 잠재적 수익 기회를 밝히고, 이 시장의 매력적인 투자 제안 매트릭스를 설명합니다.
또한 시장 촉진요인, 억제요인, 기회, 신제품 출시 및 승인, 시장 동향, 지역별 전망, 주요 기업의 경쟁 전략 등에 대한 중요한 인사이트를 제공합니다.
이 보고서는 기업 하이라이트, 제품 포트폴리오, 주요 하이라이트, 재무 성과, 전략 등의 매개 변수를 기반으로 세계 의료비 지불자 서비스 시장의 주요 기업 프로파일을 제공합니다.
이 보고서의 인사이트를 통해 마케팅 담당자와 기업 경영진은 향후 제품 출시, 유형화, 시장 확대, 마케팅 전술에 대한 정보에 입각한 의사결정을 내릴 수 있습니다.
세계 의료비 지불자 서비스 시장 보고서는 투자자, 공급업체, 제품 제조업체, 유통업체, 신규 진입자, 재무 분석가 등 다양한 이해관계자를 대상으로 합니다.
이해관계자들은 세계 의료비 지불자 서비스 시장 분석에 사용되는 다양한 전략 매트릭스를 통해 의사결정을 용이하게 할 수 있습니다.
목차
제1장 조사 목적과 가정
조사 목적
가정
약어
제2장 시장 전망
보고서 설명
시장 정의와 범위
주요 요약
Coherent Opportunity Map(COM)
제3장 시장 역학, 규제, 동향 분석
시장 역학
성장 촉진요인
성장 억제요인
기회
영향 분석
시장 동향
주요 발전
규제 시나리오
인수와 제휴 시나리오
자금 조달과 투자
PEST 분석
Porters 분석
제4장 세계의 의료비 지불자 서비스 시장 - 코로나바이러스(COVID-19) 팬데믹의 영향
전체적인 영향
정부 이니셔티브
COVID-19의 시장에 대한 영향
제5장 세계의 의료비 지불자 서비스 시장, 서비스 유형별, 2021-2032년
비즈니스 프로세스 아웃소싱
정보기술 아웃소싱
지식 프로세스 아웃소싱
제6장 세계의 의료비 지불자 서비스 시장, 용도별, 2021-2032년
클레임 관리 서비스
통합된 프론트오피스 서비스와 백오피스 업무
회원 관리 서비스
프로바이더 관리 서비스
청구 및 어카운트 관리 서비스
분석 및 부정 관리 서비스
인사 서비스
지불 관리 서비스
감사 및 분석 시스템
제7장 세계의 의료비 지불자 서비스 시장, 최종사용자별, 2021-2032년
민간 보험회사
공적 지불자
제8장 세계의 의료비 지불자 서비스 시장, 지역별, 2021-2032년
북미
라틴아메리카
유럽
아시아태평양
중동
아프리카
제9장 경쟁 구도
기업 개요
Accenture PLC
Institute BCN Esthetics SL
Hewlett-Packard
Dell, Inc.
Zeomega
Verisk Analytics, Inc.
UNITEDHEALTH GROUP
NXGN Management, LLC
MCKESSON CORPORATION
IBM Corporation
Epic Systems Corporation
eClinicalWorks
Cerner Corporation
Allscripts Healthcare Solutions, Inc.
Aetna, Inc.
Cognizant
Accenture
DXC Technology Company
Wipro
제10장 애널리스트의 추천사항
Wheel of Fortune
애널리스트의 견해
Coherent Opportunity Map
제11장 참고문헌과 조사 방법
참고문헌
조사 방법
ksm
영문 목차
영문목차
Global Healthcare Payer Services Market is estimated to be valued at USD 83.36 Bn in 2025 and is expected to reach USD 158.45 Bn by 2032, growing at a compound annual growth rate (CAGR) of 9.6% from 2025 to 2032.
Report Coverage
Report Details
Base Year:
2024
Market Size in 2025:
USD 83.36 Bn
Historical Data for:
2020 To 2024
Forecast Period:
2025 To 2032
Forecast Period 2025 to 2032 CAGR:
9.60%
2032 Value Projection:
USD 158.45 Bn
Figure. Healthcare Payer Services Market Share (%), By Region 2025
Global healthcare payer services market growth is driven by increasing focus of healthcare payers and providers on improving the overall efficiency of revenue cycle operations. Healthcare payers are emphasizing on offering improved customer services and engagement to gain a competitive edge. Moreover, growing utilization of healthcare insurance schemes and rising out-of-pocket medical expenses boosts demand for efficient payer services. Various service providers are developing and deploying advanced solutions to help payers manage shifting revenue streams, optimize claims processing, streamline administration workflows, and reduce costs.
Market Dynamics:
Global healthcare payer services market growth is driven by growing focus on curbing rising healthcare costs and improving profitability. Payers are increasingly outsourcing non-core operations to Third Party Administrators (TPAs) and other service providers to reduce expenses. Furthermore, proliferation of chronic illnesses along with rising geriatric population requiring medical insurance can boost demand for efficient claims processing and management. However, security concerns related to handling sensitive patient data and difficulties in integrating legacy systems with new solutions can hamper the market growth. Increasing uptake of cloud-based platforms and the emergence of advanced technologies, such as artificial intelligence, can offer lucrative opportunities for market players in the near future.
Key Features of the Study:
This report provides in-depth analysis of the global healthcare payer services market, and provides market size (USD Billion) and compound annual growth rate (CAGR%) for the forecast period (2025-2032), considering 2024 as the base year
It elucidates potential revenue opportunities across different segments and explains attractive investment proposition matrices for this market
This study also provides key insights about market drivers, restraints, opportunities, new product launches or approval, market trends, regional outlook, and competitive strategies adopted by key players
It profiles key players in the global healthcare payer services market based on the following parameters - company highlights, products portfolio, key highlights, financial performance, and strategies
Key companies covered as a part of this study include UnitedHealth Group, Anthem, Inc., Aetna Inc., Humana Inc., Centene Corporation
Insights from this report would allow marketers and the management authorities of the companies to make informed decisions regarding their future product launches, type up-gradation, market expansion, and marketing tactics
Global healthcare payer services market report caters to various stakeholders in this industry including investors, suppliers, product manufacturers, distributors, new entrants, and financial analysts
Stakeholders would have ease in decision-making through various strategy matrices used in analyzing the global healthcare payer services market
Detailed Segmentation-
By Service Type
Business Process Outsourcing
Information Technology Outsourcing
Knowledge Process Outsourcing
By Application
Claims Management Services
Integrated Front Office Service and Back Office Operations
Member Management Services
Provider Management Services
Billing and Accounts Management Services
Analytics and Fraud Management Services
HR Services
Payment Management Services
Audit and Analysis Systems
By End User
Private Payers
Public Payers
By Region
North America
Europe
Asia Pacific
Latin America
Middle East
Africa
Company Profiles:
Accenture PLC
Institute BCN Esthetics S.L.
Hewlett-Packard
Dell, Inc.
Zeomega
Verisk Analytics, Inc.
UNITEDHEALTH GROUP
NXGN Management, LLC
MCKESSON CORPORATION
IBM Corporation
Epic Systems Corporation
eClinicalWorks
Cerner Corporation
Allscripts Healthcare Solutions, Inc.
Aetna, Inc.
Cognizant
Accenture
DXC Technology Company
Wipro
Table of Contents
1. Research Objectives and Assumptions
Research Objectives
Assumptions
Abbreviations
2. Market Purview
Report Description
Market Definition and Scope
Executive Summary
Market Snapshot, By Service Type
Market Snapshot, By Application
Market Snapshot, By End User
Market Snapshot, By Region
Coherent Opportunity Map (COM)
3. Market Dynamics, Regulations, and Trends Analysis
Market Dynamics
Drivers
Restraints
Opportunities
Impact Analysis
Market Trends
Key Developments
Regulatory Scenario
Acquisitions and Partnerships Scenario
Funding and Investments
PEST Analysis
Porter's Analysis
4. Global Healthcare Payer Services Market - Impact of Coronavirus (COVID-19) Pandemic
Overall Impact
Government Initiatives
COVID-19 Impact on the Market
5. Global Healthcare Payer Services Market, By Service Type, 2021 - 2032, (USD Bn)
Overview
Market Share Analysis, 2025 and 2032 (%)
Y-o-Y Growth Analysis, 2021 - 2032
Segment Trends
Business Process Outsourcing
Overview
Market Size and Forecast, and Y-o-Y Growth, 2020-2032, (USD Bn)
Information Technology Outsourcing
Overview
Market Size and Forecast, and Y-o-Y Growth, 2020-2032, (USD Bn)
Knowledge Process Outsourcing
Overview
Market Size and Forecast, and Y-o-Y Growth, 2020-2032, (USD Bn)
6. Global Healthcare Payer Services Market, By Application, 2021 - 2032, (USD Bn)
Overview
Market Share Analysis, 2025 and 2032 (%)
Y-o-Y Growth Analysis, 2021 - 2032
Segment Trends
Claims Management Services
Overview
Market Size and Forecast, and Y-o-Y Growth, 2020-2032, (USD Bn)
Integrated Front Office Service and Back Office Operations
Overview
Market Size and Forecast, and Y-o-Y Growth, 2020-2032, (USD Bn)
Member Management Services
Overview
Market Size and Forecast, and Y-o-Y Growth, 2020-2032, (USD Bn)
Provider Management Services
Overview
Market Size and Forecast, and Y-o-Y Growth, 2020-2032, (USD Bn)
Billing and Accounts Management Services
Overview
Market Size and Forecast, and Y-o-Y Growth, 2020-2032, (USD Bn)
Analytics and Fraud Management Services
Overview
Market Size and Forecast, and Y-o-Y Growth, 2020-2032, (USD Bn)
HR Services
Overview
Market Size and Forecast, and Y-o-Y Growth, 2020-2032, (USD Bn)
Payment Management Services
Overview
Market Size and Forecast, and Y-o-Y Growth, 2020-2032, (USD Bn)
Audit and Analysis Systems
Overview
Market Size and Forecast, and Y-o-Y Growth, 2020-2032, (USD Bn)
7. Global Healthcare Payer Services Market, By End User, 2021 - 2032, (USD Bn)
Overview
Market Share Analysis, 2025 and 2032 (%)
Y-o-Y Growth Analysis, 2021 - 2032
Segment Trends
Private Payers
Overview
Market Size and Forecast, and Y-o-Y Growth, 2020-2032, (USD Bn)
Public Payers
Overview
Market Size and Forecast, and Y-o-Y Growth, 2020-2032, (USD Bn)
8. Global Healthcare Payer Services Market, By Region, 2021 - 2032, (USD Bn)
Introduction
Market Share Analysis, By Region, 2025 and 2032 (%)
Y-o-Y Growth Analysis, For Region, 2020-2032
Regional Trends
North America
Introduction
Market Size and Forecast, and Y-o-Y Growth, By Service Type, 2020 - 2032, (USD Bn)
Market Size and Forecast, and Y-o-Y Growth, By Application, 2020 - 2032, (USD Bn)
Market Size and Forecast, and Y-o-Y Growth, By End User, 2020 - 2032, (USD Bn)
Market Size and Forecast, and Y-o-Y Growth, By Country, 2021 - 2032, (USD Bn)
U.S.
Canada
Latin America
Introduction
Market Size and Forecast, and Y-o-Y Growth, By Service Type, 2020 - 2032, (USD Bn)
Market Size and Forecast, and Y-o-Y Growth, By Application, 2020 - 2032, (USD Bn)
Market Size and Forecast, and Y-o-Y Growth, By End User, 2020 - 2032, (USD Bn)
Market Size and Forecast, and Y-o-Y Growth, By Country, 2021 - 2032, (USD Bn)
Brazil
Mexico
Argentina
Rest of Latin America
Europe
Introduction
Market Size and Forecast, and Y-o-Y Growth, By Service Type, 2020 - 2032, (USD Bn)
Market Size and Forecast, and Y-o-Y Growth, By Application, 2020 - 2032, (USD Bn)
Market Size and Forecast, and Y-o-Y Growth, By End User, 2020 - 2032, (USD Bn)
Market Size and Forecast, and Y-o-Y Growth, By Country, 2021 - 2032, (USD Bn)
U.K.
Germany
Italy
France
Spain
Russia
Rest of Europe
Asia Pacific
Introduction
Market Size and Forecast, and Y-o-Y Growth, By Service Type, 2020 - 2032, (USD Bn)
Market Size and Forecast, and Y-o-Y Growth, By Application, 2020 - 2032, (USD Bn)
Market Size and Forecast, and Y-o-Y Growth, By End User, 2020 - 2032, (USD Bn)
Market Size and Forecast, and Y-o-Y Growth, By Country, 2021 - 2032, (USD Bn)
China
India
Japan
ASEAN
Australia
South Korea
Rest of Asia Pacific
Middle East
Introduction
Market Size and Forecast, and Y-o-Y Growth, By Service Type, 2020 - 2032, (USD Bn)
Market Size and Forecast, and Y-o-Y Growth, By Application, 2020 - 2032, (USD Bn)
Market Size and Forecast, and Y-o-Y Growth, By End User, 2020 - 2032, (USD Bn)
Market Size and Forecast, and Y-o-Y Growth, By Country, 2021 - 2032, (USD Bn)
GCC Countries
Israel
Rest of Middle East
Africa
Introduction
Market Size and Forecast, and Y-o-Y Growth, By Service Type, 2020 - 2032, (USD Bn)
Market Size and Forecast, and Y-o-Y Growth, By Application, 2020 - 2032, (USD Bn)
Market Size and Forecast, and Y-o-Y Growth, By End User, 2020 - 2032, (USD Bn)
Market Size and Forecast, and Y-o-Y Growth, By Country/Region, 2021 - 2032, (USD Bn)