Cross Docking Services Market, By Service Type, By Technology Integration, By Ownership Model, By Industry Vertical, By Geography
상품코드:1705648
리서치사:Coherent Market Insights
발행일:2025년 02월
페이지 정보:영문
라이선스 & 가격 (부가세 별도)
ㅁ Add-on 가능: 고객의 요청에 따라 일정한 범위 내에서 Customization이 가능합니다. 자세한 사항은 문의해 주시기 바랍니다.
한글목차
세계 크로스 도킹 서비스 시장은 2025년에 62억 7,000만 달러로 추정되며, 2032년에는 94억 3,000만 달러에 달할 것으로 예상되며, 2025년부터 2032년까지 연평균 6.0%의 CAGR을 기록할 것으로 예상됩니다.
보고서 범위
보고서 상세
기준 연도
2024년
2025년 시장 규모
62억 7,000만 달러
실적 데이터
2020-2024년
예측 기간
2025-2032년
예측 기간 : 2025-2032년 CAGR
6.00%
2032년 가치 예측
94억 3,000만 달러
그림. 크로스 도킹 서비스 시장 점유율(%), 지역별, 2025년
크로스 도킹은 공급망 관리 기법 중 하나로, 입고와 출고 사이에 거의 또는 전혀 보관하지 않고 상품을 이동시키는 것을 말합니다. 보관 시간과 취급을 줄임으로써 크로스 도킹은 재고 회전율 향상과 비용 절감에 기여합니다. 물류센터 내에서 상품이 빠르게 이동하기 때문에 기업은 안전재고를 줄일 수 있습니다. 정확한 예측과 적시 운송을 보장하기 위해 공급업체와 고객 간의 사전 커뮤니케이션은 크로스 도킹에 필수적입니다. 도입은 복잡하지만, 크로스 도킹은 물류 기업에게 수요 변화에 동적으로 대응할 수 있는 유연성을 제공합니다.
시장 역학:
E-Commerce 활동의 활성화는 크로스 도킹 서비스 시장의 주요 촉진요인입니다. 온라인 소매업체들은 고객 유지를 위해 신속한 주문 처리에 의존하고 있으며, 적시 배송 네트워크가 필수적입니다. 또한, 세계 조달과 다채널 유통으로 인한 공급망의 복잡성으로 인해 기업들은 크로스 도킹과 같은 효율적인 창고 관리 기술을 채택할 수밖에 없습니다. 그러나 인프라 업그레이드와 근로자 재교육을 위한 높은 투자 요구사항이 시장 성장의 걸림돌로 작용하고 있습니다. 사물인터넷(Internet of Things)과 자동화 기술의 발전은 실시간 추적 및 자동 자재 취급을 통해 크로스 도킹 작업을 최적화할 수 있는 새로운 기회를 창출하고 있습니다.
본 조사의 주요 특징
세계의 크로스 도킹 서비스 시장에 대해 조사 분석했으며, 2024년을 기준 연도로 하여 예측 기간(2025-2032년)의 시장 규모와 연평균 성장률(CAGR)을 조사하여 정리하여 전해드립니다.
또한, 다양한 부문에 걸친 잠재적인 수익 성장 기회를 밝히고, 이 시장의 매력적인 투자 제안 매트릭스를 설명합니다.
또한 시장 촉진요인, 억제요인, 기회, 신제품 출시 및 승인, 시장 동향, 지역별 전망, 주요 기업의 경쟁 전략 등에 대한 중요한 인사이트를 제공합니다.
이 보고서는 기업 하이라이트, 제품 포트폴리오, 주요 하이라이트, 재무 성과, 전략 등의 매개 변수를 기반으로 세계 크로스 도킹 서비스 시장의 주요 기업을 프로파일링합니다.
이 보고서의 인사이트를 통해 마케팅 담당자와 기업 경영진은 향후 제품 출시, 유형 업그레이드, 시장 확대, 마케팅 전술에 대한 정보에 입각한 의사결정을 내릴 수 있습니다.
이 보고서는 투자자, 공급업체, 제품 제조업체, 유통업체, 신규 진입자, 재무 분석가 등 업계의 다양한 이해관계자를 대상으로 합니다.
목차
제1장 조사 목적과 가정
조사 목적
가정
약어
제2장 시장 전망
보고서 설명
시장 정의와 범위
주요 요약
Coherent Opportunity Map(COM)
제3장 시장 역학, 규제, 동향 분석
시장 역학
성장 촉진요인
성장 억제요인
기회
규제 시나리오
업계 동향
인수합병
신시스템 출시/승인
COVID-19 팬데믹의 영향
제4장 세계의 크로스 도킹 서비스 시장, 서비스 유형별, 2020-2032년
기존 크로스 도킹
기회적 크로스 도킹
통합 크로스 도킹
혼재 크로스 도킹
제5장 세계의 크로스 도킹 서비스 시장, 기술 통합별, 2020-2032년
자동 크로스 도킹 시스템
RFID 추적 시스템
창고 관리 시스템(WMS)
운송 관리 시스템(TMS)
제6장 세계의 크로스 도킹 서비스 시장, 소유 모델별, 2020-2032년
제3자 물류(3PL) 프로바이더
사내 크로스 도킹 업무
제7장 세계의 크로스 도킹 서비스 시장, 업계별, 2020-2032년
소매
식품 및 음료 부문
제조업
자동차
헬스케어와 의약품
E-Commerce
건설
기타
제8장 세계의 크로스 도킹 서비스 시장, 지역별, 2020-2032년
북미
유럽
아시아태평양
라틴아메리카
중동 및 아프리카
제9장 경쟁 구도
기업 개요
Ryder System
Kenco Group
Kane Logistics
XPO Logistics
Cannon Hill Logistics
JB Hunt
Hub Group
Saddle Creek
Toll Group
Deutsche Bahn Group
Delivery Lane Express
Kanban Logistics
3PL Worldwide
Omni Logistics
First Call Logistics
PDM Company
제10장 애널리스트의 추천사항
Wheel of Fortune
애널리스트의 견해
Coherent Opportunity Map
제11장 조사 방법
참고문헌
조사 방법
ksm
영문 목차
영문목차
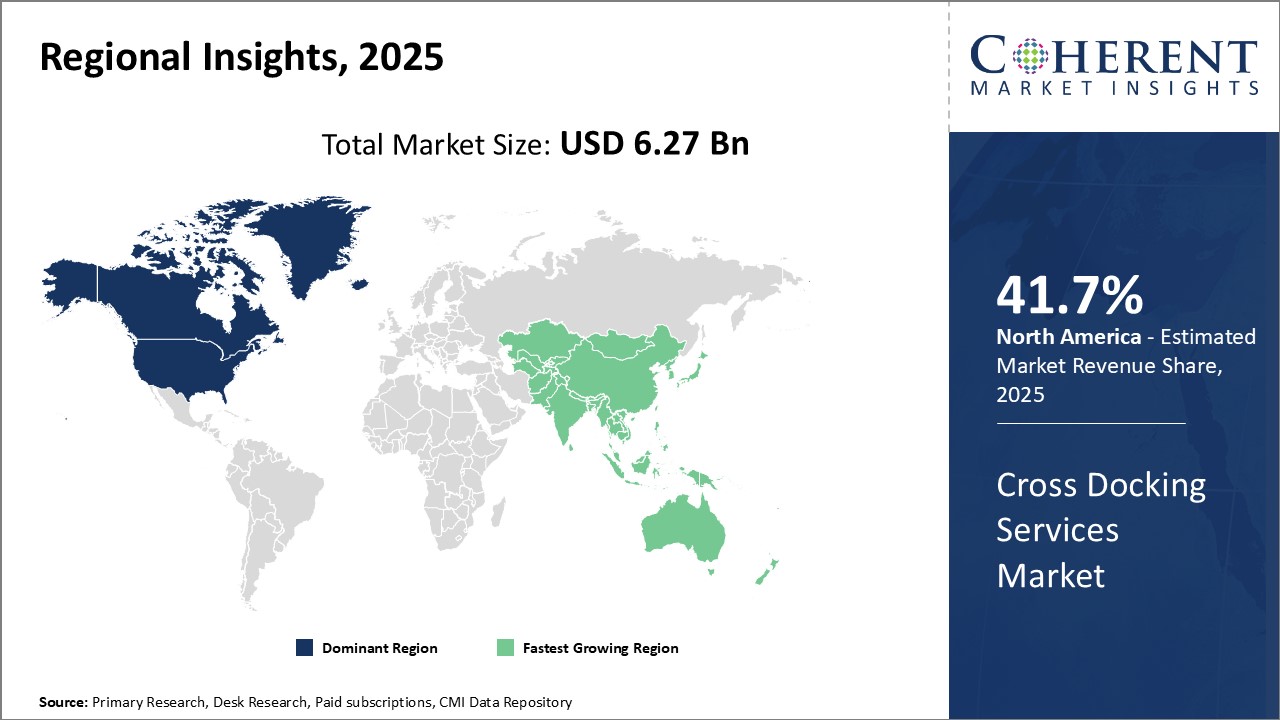
Global Cross Docking Services Market is estimated to be valued at USD 6.27 Bn in 2025 and is expected to reach USD 9.43 Bn by 2032, growing at a compound annual growth rate (CAGR) of 6.0% from 2025 to 2032.
Report Coverage
Report Details
Base Year:
2024
Market Size in 2025:
USD 6.27 Bn
Historical Data for:
2020 To 2024
Forecast Period:
2025 To 2032
Forecast Period 2025 to 2032 CAGR:
6.00%
2032 Value Projection:
USD 9.43 Bn
Figure. Cross Docking Services Market Share (%), By Region 2025
Cross docking is a supply chain management technique in which goods are transferred between incoming and outgoing transports with little or no storage in between. By reducing storage time and handling, cross docking helps improve inventory turns and lower costs. It allows companies to hold less safety stock as goods rapidly flow through distribution centers. Advance communication between suppliers and customers is integral to cross docking to ensure accurate forecasting and timely transports. While complex to implement, cross docking offers logistics firms the flexibility to dynamically respond to demand shifts.
Market Dynamics:
Rising e-commerce activities are a key driver for the cross docking services market. Online retailers rely on quick fulfillment of orders to retain customers, making just-in-time delivery networks essential. Additionally, supply chain complexities posed by global sourcing and multi-channel distribution are compelling companies to adopt efficient warehousing techniques like cross docking. However, high investment requirements for infrastructure upgrades and labor retraining pose challenges for market growth. Ongoing development of Internet of Things and automation technologies are opening new opportunities to optimize cross docking operations through real-time tracking and automated material handling.
Key Features of the Study:
This report provides an in-depth analysis of the global cross docking services market, and provides market size (US$ Billion) and compound annual growth rate (CAGR %) for the forecast period (2025-2032), considering 2024 as the base year
It elucidates potential revenue growth opportunities across different segments and explains attractive investment proposition matrices for this market
This study also provides key insights about market drivers, restraints, opportunities, new product launches or approvals, market trends, regional outlook, and competitive strategies adopted by key players
It profiles key players in the global cross docking services market based on the following parameters - company highlights, products portfolio, key highlights, financial performance, and strategies
Key companies covered as a part of this study include Ryder System, Kenco Group, Kane Logistics, XPO Logistics, Cannon Hill Logistics, J.B. Hunt, Hub Group, Saddle Creek, Toll Group, Deutsche Bahn Group, Delivery Lane Express, Kanban Logistics, 3PL Worldwide, Omni Logistics, First Call Logistics, and PDM Company
Insights from this report would allow marketers and the management authorities of the companies to make informed decisions regarding their future product launches, type up-gradation, market expansion, and marketing tactics
The global cross docking services market report caters to various stakeholders in this industry including investors, suppliers, product manufacturers, distributors, new entrants, and financial analysts
Market Segmentation
By Service Type
Traditional Cross-Docking
Opportunistic Cross-Docking
Consolidation Cross-Docking
Deconsolidation Cross-Docking
By Technology Integration
Automated Cross-Docking Systems
RFID Tracking Systems
Warehouse Management Systems (WMS)
Transportation Management Systems (TMS)
By Ownership Model
Third-Party Logistics (3PL) Providers
In-house Cross-Docking Operations
By Industry Vertical
Retail
Food and Beverages Sector
Manufacturing
Automotive
Healthcare and Pharmaceuticals
E-commerce
Construction
Others
By Regional
Overnight Facilities
Guided Tours
Transport Rentals
Food Services
Souvenir Shops
Others
Key Players Insights
Ryder System
Kenco Group
Kane Logistics
XPO Logistics
Cannon Hill Logistics
J.B. Hunt
Hub Group
Saddle Creek
Toll Group
Deutsche Bahn Group
Delivery Lane Express
Kanban Logistics
3PL Worldwide
Omni Logistics
First Call Logistics
PDM Company
Table of Contents
1. Research Objectives and Assumptions
Research Objectives
Assumptions
Abbreviations
2. Market Purview
Report Description
Market Definition and Scope
Executive Summary
Market Snippet, By Service Type
Market Snippet, By Technology Integration
Market Snippet, By Ownership Model
Market Snippet, By Industry Vertical
Market Snippet, By Region
Coherent Opportunity Map (COM)
3. Market Dynamics, Regulations, and Trends Analysis
Market Dynamics
Drivers
Restraints
Opportunities
Regulatory Scenario
Industry Trend
Merger and Acquisitions
New system Launch/Approvals
Impact of the COVID-19 Pandemic
4. Global Cross Docking Services Market, By Service Type, 2020-2032, (US$ Billion)
Introduction
Market Share Analysis, 2025 and 2032 (%)
Y-o-Y Growth Analysis, 2020-2032
Segment Trends
Traditional Cross-Docking
Introduction
Market Size and Forecast, 2020-2032, (US$ Billion)
Opportunistic Cross-Docking
Introduction
Market Size and Forecast, 2020-2032, (US$ Billion)
Consolidation Cross-Docking
Introduction
Market Size and Forecast, 2020-2032, (US$ Billion)
Deconsolidation Cross-Docking
Introduction
Market Size and Forecast, 2020-2032, (US$ Billion)
5. Global Cross Docking Services Market, By Technology Integration, 2020-2032, (US$ Billion)
Introduction
Market Share Analysis, 2025 and 2032 (%)
Y-o-Y Growth Analysis, 2020-2032
Segment Trends
Automated Cross-Docking Systems
Introduction
Market Size and Forecast, 2020-2032, (US$ Billion)
RFID Tracking Systems
Introduction
Market Size and Forecast, 2020-2032, (US$ Billion)
Warehouse Management Systems (WMS)
Introduction
Market Size and Forecast, 2020-2032, (US$ Billion)
Transportation Management Systems (TMS)
Introduction
Market Size and Forecast, 2020-2032, (US$ Billion)
6. Global Cross Docking Services Market, By Ownership Model, 2020-2032, (US$ Billion)
Introduction
Market Share Analysis, 2025 and 2032 (%)
Y-o-Y Growth Analysis, 2020-2032
Segment Trends
Third-Party Logistics (3PL) Providers
Introduction
Market Size and Forecast, 2020-2032, (US$ Billion)
In-house Cross-Docking Operations
Introduction
Market Size and Forecast, 2020-2032, (US$ Billion)
7. Global Cross Docking Services Market, By Industry Vertical, 2020-2032, (US$ Billion)
Introduction
Market Share Analysis, 2025 and 2032 (%)
Y-o-Y Growth Analysis, 2020-2032
Segment Trends
Retail
Introduction
Market Size and Forecast, 2020-2032, (US$ Billion)
Food and Beverages Sector
Introduction
Market Size and Forecast, 2020-2032, (US$ Billion)
Manufacturing
Introduction
Market Size and Forecast, 2020-2032, (US$ Billion)
Automotive
Introduction
Market Size and Forecast, 2020-2032, (US$ Billion)
Healthcare and Pharmaceuticals
Introduction
Market Size and Forecast, 2020-2032, (US$ Billion)
E-commerce
Introduction
Market Size and Forecast, 2020-2032, (US$ Billion)
Construction
Introduction
Market Size and Forecast, 2020-2032, (US$ Billion)
Others
Introduction
Market Size and Forecast, 2020-2032, (US$ Billion)
8. Global Cross Docking Services Market, By Region, 2020-2032, (US$ Billion)
Introduction
Market Share Analysis, By Region, 2025 and 2032 (%)
Y-o-Y Growth Analysis, 2020-2032
North America
Regional Trends
Market Size and Forecast, By Service Type, 2020-2032, (US$ Billion)
Market Size and Forecast, By Technology Integration, 2020-2032, (US$ Billion)
Market Size and Forecast, By Ownership Model, 2020-2032, (US$ Billion)
Market Size and Forecast, By Industry Vertical, 2020-2032, (US$ Billion)
Market Size and Forecast, By Country, 2020-2032, (US$ Billion)
U.S.
Canada
Europe
Regional Trends
Market Size and Forecast, By Service Type, 2020-2032, (US$ Billion)
Market Size and Forecast, By Technology Integration, 2020-2032, (US$ Billion)
Market Size and Forecast, By Ownership Model, 2020-2032, (US$ Billion)
Market Size and Forecast, By Industry Vertical, 2020-2032, (US$ Billion)
Market Size and Forecast, By Country, 2020-2032, (US$ Billion)
U.K.
Germany
Italy
France
Russia
Rest of Europe
Asia Pacific
Regional Trends
Market Size and Forecast, By Service Type, 2020-2032, (US$ Billion)
Market Size and Forecast, By Technology Integration, 2020-2032, (US$ Billion)
Market Size and Forecast, By Ownership Model, 2020-2032, (US$ Billion)
Market Size and Forecast, By Industry Vertical, 2020-2032, (US$ Billion)
Market Size and Forecast, By Country, 2020-2032, (US$ Billion)
China
India
ASEAN
Australia
South Korea
Japan
Rest of Asia Pacific
Latin America
Regional Trends
Market Size and Forecast, By Service Type, 2020-2032, (US$ Billion)
Market Size and Forecast, By Technology Integration, 2020-2032, (US$ Billion)
Market Size and Forecast, By Ownership Model, 2020-2032, (US$ Billion)
Market Size and Forecast, By Industry Vertical, 2020-2032, (US$ Billion)
Market Size and Forecast, By Country, 2020-2032, (US$ Billion)
Brazil
Argentina
Mexico
Rest of Latin America
Middle East & Africa
Regional Trends
Market Size and Forecast, By Service Type, 2020-2032, (US$ Billion)
Market Size and Forecast, By Technology Integration, 2020-2032, (US$ Billion)
Market Size and Forecast, By Ownership Model, 2020-2032, (US$ Billion)
Market Size and Forecast, By Industry Vertical, 2020-2032, (US$ Billion)
Market Size and Forecast, By Country, 2020-2032, (US$ Billion)