Optical Spectrum Analyzer Market, By Type (Portable, Handheld, and Benchtop), By End-use Industry (Telecommunication, Healthcare, Consumer Electronics, and Others), By Geography (North America, Latin America, Europe, Asia Pacific, Middle East & Africa)
상품코드:1674329
리서치사:Coherent Market Insights
발행일:2025년 02월
페이지 정보:영문
라이선스 & 가격 (부가세 별도)
ㅁ Add-on 가능: 고객의 요청에 따라 일정한 범위 내에서 Customization이 가능합니다. 자세한 사항은 문의해 주시기 바랍니다.
한글목차
광 스펙트럼 분석기 세계 시장 규모는 2025년에 3억 7,800만 달러로 추정되며, 2032년에는 6억 1,540만 달러에 달할 것으로 예상되며, 2025-2032년 7.2%의 CAGR로 성장할 것으로 예상됩니다.
보고서 범위
보고서 상세 내용
기준 연도
2024년
2025년 시장 규모
3억 7,800만 달러
실적 데이터
2020-2024년
예측 기간
2025-2032년
예측 기간 : 2025-2032년 CAGR
7.20%
2032년 가치 예측
6억 1,540만 달러
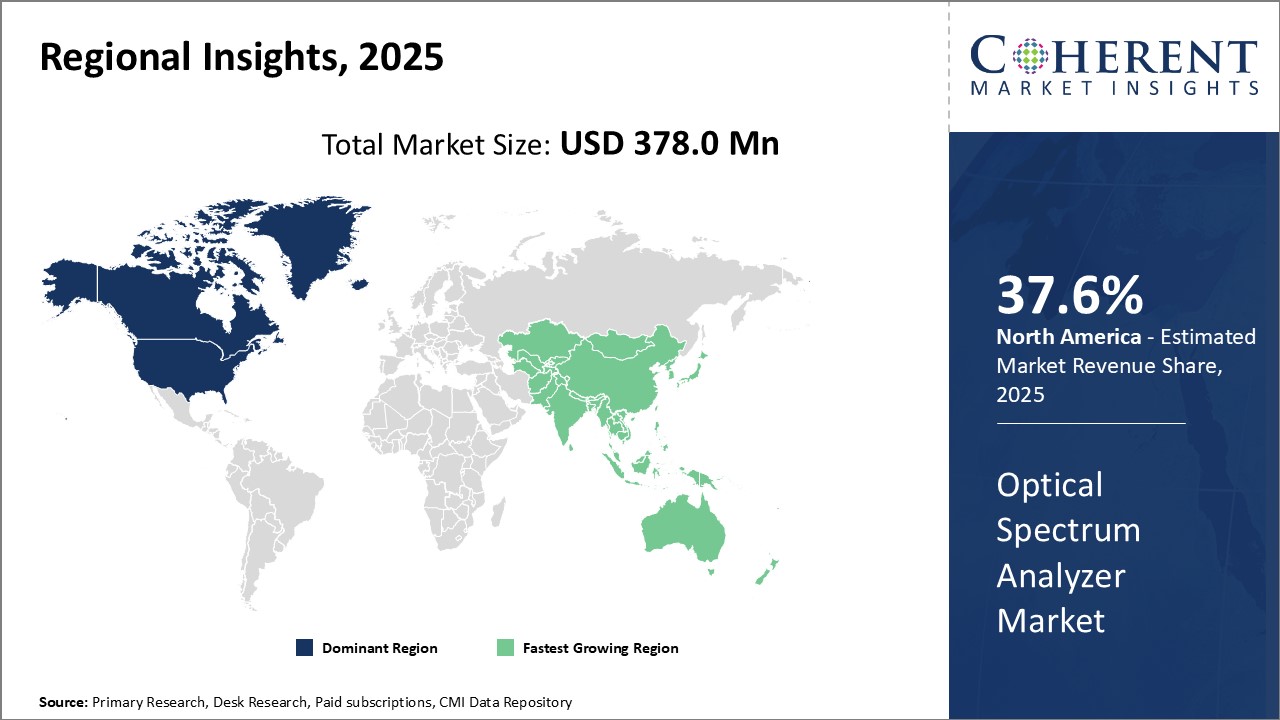
그림. 광 스펙트럼 분석기 시장 점유율(%), 2025년, 지역별
세계 광 스펙트럼 분석기 시장은 다양한 산업 분야에서 광 부품 및 광 시스템의 적용이 확대됨에 따라 괄목할 만한 성장을 보이고 있습니다. 광 스펙트럼 분석기는 다양한 광 신호의 파워 레벨, 파장, 변조 형식 등의 파라미터를 측정하고 분석하는 데 중요한 역할을 합니다. 광 스펙트럼 분석기는 통신, 자동차, 의료, 소비자 전자기기 등의 산업에서 파이버 테스트, 파장 모니터링, 분산 측정, 신호 품질 모니터링 등의 용도로 사용됩니다. 광기술의 전송은 고속 데이터 전송과 원활한 연결을 가능하게 했습니다. 그러나 최적의 성능을 보장하기 위해 세심한 검사와 모니터링이 필요한 광 네트워크의 복잡성도 증가하고 있습니다. 이는 전 세계적으로 광 스펙트럼 분석기 수요의 확대에 기여하고 있습니다.
시장 역학
광 스펙트럼 분석기 세계 시장 성장의 원동력은 통신 및 데이터 전송을 위한 광섬유 네트워크의 확장, 무선 인프라의 성장, 첨단 광학 부품에 대한 R&D 투자 증가 등의 요인입니다. 급속한 디지털화로 인해 네트워크 상의 데이터 트래픽이 증가하면서 광섬유를 통한 고속 전송에 대한 관심이 높아지고 있습니다. 이에 따라 신호 품질과 네트워크의 건전성을 지속적으로 모니터링하는 광 스펙트럼 분석기와 같은 신뢰할 수 있는 검사 장비의 필요성이 높아지고 있습니다. 그러나 OSA 장비의 높은 초기 비용은 특히 개발도상국에서의 보급을 가로막고 있습니다. 반면, 컴팩트하고 휴대 가능한 분석기의 개발로 현장 엔지니어와 유지보수 팀을 위한 새로운 성장 기회가 창출되고 있습니다. 또한, 고해상도화, 자동화 프로세스, 통합 기능에 대한 끊임없는 기술 혁신은 광 스펙트럼 분석기의 적용 범위를 더욱 확장하고 있습니다.
이 조사의 주요 특징
세계의 광 스펙트럼 분석기 시장에 대해 조사 분석했으며, 2024년을 기준 연도로 하여 예측 기간(2025-2032년)의 시장 규모와 연평균 성장률(CAGR)을 조사하여 전해드립니다.
또한, 다양한 부문에 걸친 잠재적 수익 기회를 밝히고, 이 시장의 매력적인 투자 제안 매트릭스를 설명합니다.
또한 시장 촉진요인, 억제요인, 기회, 신제품 출시 및 승인, 시장 동향, 지역별 전망, 주요 기업의 경쟁 전략 등에 대한 중요한 인사이트를 제공합니다.
이 보고서는 회사 하이라이트, 제품 포트폴리오, 주요 하이라이트, 재무 성과, 전략 등의 매개 변수를 기반으로 세계 광 스펙트럼 분석기 시장의 주요 기업을 프로파일링합니다.
주요 기업으로는 Ams Technologies AG, Anritsu Corporation, Coherent(II-VI Incorporated), EXFO Inc., Keysight Technologies, Luna Innovations Incorporated, MTS Systems Corporation, Nicolet Technologies, Optoplex Corporation, Tektronix Inc., Thorlabs Inc., Viavi Solutions Inc., Yokogawa Electric Corporation, Zygo Corporation, ZTE Corporation 등이 있습니다.
이 보고서의 인사이트를 통해 마케팅 담당자와 기업 경영진은 향후 제품 출시, 유형 업그레이드, 시장 확대, 마케팅 전술에 대한 정보에 입각한 의사결정을 내릴 수 있습니다.
이 보고서는 투자자, 공급업체, 제품 제조업체, 유통업체, 신규 진입자, 재무 분석가 등 이 산업의 다양한 이해관계자를 대상으로 합니다.
이해관계자들은 세계 광 스펙트럼 분석기 시장 분석에 사용되는 다양한 전략 매트릭스를 통해 의사결정을 쉽게 내릴 수 있습니다.
목차
제1장 조사 목적과 가정
조사 목적
가정
약어
제2장 시장 전망
보고서 설명
시장 정의와 범위
주요 요약
제3장 시장 역학, 규제, 동향 분석
시장 역학
성장 촉진요인
성장 억제요인
시장 기회
규제 시나리오
산업 동향
인수합병
신시스템의 도입/승인
COVID-19 팬데믹의 영향
제4장 세계의 광 스펙트럼 분석기 시장, 유형별, 2020-2032년
소개
휴대용
핸드헬드
벤치톱
제5장 세계의 광 스펙트럼 분석기 시장, 최종 이용 산업별, 2020-2032년
소개
통신
의료
가전제품
기타
제6장 세계의 광 스펙트럼 분석기 시장, 지역별, 2020-2032년
소개
북미
유럽
아시아태평양
라틴아메리카
중동 및 아프리카
제7장 경쟁 구도
기업 개요
Ams Technologies AG
Anritsu Corporation
Coherent(II-VI Incorporated)
EXFO Inc.
Keysight Technologies
Luna Innovations Incorporated
MTS Systems Corporation
Nicolet Technologies
Optoplex Corporation
Tektronix Inc.
Thorlabs Inc.
Viavi Solutions Inc.
Yokogawa Electric Corporation
Zygo Corporation
ZTE Corporation
제8장 애널리스트의 추천사항
Wheel of Fortune
Coherent Opportunity Map
제9장 참고문헌과 조사 방법
참고문헌
조사 방법
ksm
영문 목차
영문목차
Global Optical Spectrum Analyzer Market is estimated to be valued at USD 378.0 Mn in 2025 and is expected to reach USD 615.4 Mn by 2032, growing at a compound annual growth rate (CAGR) of 7.2% from 2025 to 2032.
Report Coverage
Report Details
Base Year:
2024
Market Size in 2025:
USD 378.0 Mn
Historical Data for:
2020 To 2024
Forecast Period:
2025 To 2032
Forecast Period 2025 to 2032 CAGR:
7.20%
2032 Value Projection:
USD 615.4 Mn
Figure. Optical Spectrum Analyzer Market Share (%), By Region 2025
The global optical spectrum analyzer market is witnessing significant growth due to increasing applications of optical components and systems across different industry verticals. Optical spectrum analyzers play a crucial role in measuring and analyzing parameters like power levels, wavelengths and modulation formats of various optical signals. They are used across telecommunication, automotive, healthcare and consumer electronics industries for applications such as fiber testing, wavelength monitoring, dispersion measurement, and signal quality monitoring. Advances in optical technologies have enabled high speed data transmission and seamless connectivity. However, it has also increased the complexity of optical networks which need to be carefully tested and monitored for ensuring optimal performance. This factor has been a major driver contributing to the growing demand for optical spectrum analyzers globally.
Market Dynamics:
The global optical spectrum analyzer market growth is driven by factors such as increasing deployment of fiber optic networks for telecommunication and data transmission, growth in wireless infrastructure and rising investments in research and development of advanced optical components. Rapid digitization has boosted the data traffic across networks which is shifting focus towards high speed transmission through optical fibers. This is propelling the need for reliable testing equipment like Optical Spectrum Analyzers for continuously monitoring signal quality and network health. However, high initial costs of OSA equipment is a major restraint hampering its widespread adoption, especially in developing nations. On the positive side, development of compact and portable analyzers is opening up new growth opportunities by catering to field engineers and maintenance teams. Additionally, continuous technological innovations towards higher resolution, automated processes and integrated functionalities are further expanding the application scope of optical spectrum analyzers.
Key features of the study:
This report provides in-depth analysis of the global optical spectrum analyzer market, and provides market size (US$ Mn) and compound annual growth rate (CAGR%) for the forecast period (2025-2032), considering 2024 as the base year.
It elucidates potential revenue opportunities across different segments and explains attractive investment proposition matrices for this market.
This study also provides key insights about market drivers, restraints, opportunities, new product launches or approval, market trends, regional outlook, and competitive strategies adopted by key players.
It profiles key players in the global optical spectrum analyzer market based on the following parameters - company highlights, products portfolio, key highlights, financial performance, and strategies.
Key companies covered as a part of this study include Ams Technologies AG, Anritsu Corporation, Coherent (II-VI Incorporated), EXFO Inc., Keysight Technologies, Luna Innovations Incorporated, MTS Systems Corporation, Nicolet Technologies, Optoplex Corporation, Tektronix Inc., Thorlabs Inc., Viavi Solutions Inc., Yokogawa Electric Corporation, Zygo Corporation, and ZTE Corporation.
Insights from this report would allow marketers and the management authorities of the companies to make informed decisions regarding their future product launches, type up-gradation, market expansion, and marketing tactics.
The global optical spectrum analyzer market report caters to various stakeholders in this industry including investors, suppliers, product manufacturers, distributors, new entrants, and financial analysts.
Stakeholders would have ease in decision-making through various strategy matrices used in analyzing the global optical spectrum analyzer market.
Detailed Segmentation:
By Type
Portable
Handheld
Benchtop
By End-use Industry
Telecommunication
Healthcare
Consumer Electronics
Others
By Region
North America
Europe
Asia Pacific
Latin America
Middle East & Africa
Key Players Insights
Ams Technologies AG
Anritsu Corporation
Coherent (II-VI Incorporated)
EXFO Inc.
Keysight Technologies
Luna Innovations Incorporated
MTS Systems Corporation
Nicolet Technologies
Optoplex Corporation
Tektronix Inc.
Thorlabs Inc.
Viavi Solutions Inc.
Yokogawa Electric Corporation
Zygo Corporation
ZTE Corporation
Table of Contents
1. Research Objectives and Assumptions
Research Objectives
Assumptions
Abbreviations
2. Market Purview
Report Description
Market Definition and Scope
Executive Summary
Market Snippet, By Type
Market Snippet, By End-use Industry
Market Snippet, By Region
3. Market Dynamics, Regulations, and Trends Analysis
Market Dynamics
Drivers
Restraints
Market Opportunities
Regulatory Scenario
Industry Trend
Merger and Acquisitions
New System Launches/Approvals
Impact of COVID-19 Pandemic
4. Global Optical Spectrum Analyzer Market, By Type, 2020-2032 (US$ Mn)
Introduction
Market Share Analysis, 2025 and 2032 (%)
Y-o-Y Growth Analysis, 2020-2032
Segment Trends
Portable
Introduction
Market Size and Forecast, 2020-2032, (US$ Mn)
Handheld
Introduction
Market Size and Forecast, 2020-2032, (US$ Mn)
Benchtop
Introduction
Market Size and Forecast, 2020-2032, (US$ Mn)
5. Global Optical Spectrum Analyzer Market, By End-use Industry, 2020-2032 (US$ Mn)
Introduction
Market Share Analysis, 2025 and 2032 (%)
Y-o-Y Growth Analysis, 2020-2032
Segment Trends
Telecommunication
Introduction
Market Size and Forecast, 2020-2032, (US$ Mn)
Healthcare
Introduction
Market Size and Forecast, 2020-2032, (US$ Mn)
Consumer Electronics
Introduction
Market Size and Forecast, 2020-2032, (US$ Mn)
Others
Introduction
Market Size and Forecast, 2020-2032, (US$ Mn)
6. Global Optical Spectrum Analyzer Market, By Region, 2020-2032 (US$ Mn)
Introduction
Market Share Analysis, By Region, 2025 and 2032 (%)
North America
Regional Trends
Market Size and Forecast, By Type, 2020-2032 (US$ Mn)
Market Size and Forecast, By End-use Industry, 2020-2032 (US$ Mn)
Market Share Analysis, By Country, 2025 and 2032 (%)
U.S.
Canada
Europe
Regional Trends
Market Size and Forecast, By Type, 2020-2032 (US$ Mn)
Market Size and Forecast, By End-use Industry, 2020-2032 (US$ Mn)
Market Share Analysis, By Country, 2025 and 2032 (%)
U.K.
Germany
France
Russia
Rest of Europe
Asia Pacific
Regional Trends
Market Size and Forecast, By Type, 2020-2032 (US$ Mn)
Market Size and Forecast, By End-use Industry, 2020-2032 (US$ Mn)
Market Share Analysis, By Country, 2025 and 2032 (%)
China
India
Japan
ASEAN
Australia
South Korea
Rest of Asia Pacific
Latin America
Regional Trends
Market Size and Forecast, By Type, 2020-2032 (US$ Mn)
Market Size and Forecast, By End-use Industry, 2020-2032 (US$ Mn)
Market Share Analysis, By Country, 2025 and 2032 (%)
Brazil
Argentina
Mexico
Rest of Latin America
Middle East & Africa
Regional Trends
Market Size and Forecast, By Type, 2020-2032 (US$ Mn)
Market Size and Forecast, By End-use Industry, 2020-2032 (US$ Mn)
Market Share Analysis, By Country, 2025 and 2032 (%)