Cap Applicator Market, By Type, By Application, By Geography
상품코드:1674082
리서치사:Coherent Market Insights
발행일:2025년 02월
페이지 정보:영문
라이선스 & 가격 (부가세 별도)
ㅁ Add-on 가능: 고객의 요청에 따라 일정한 범위 내에서 Customization이 가능합니다. 자세한 사항은 문의해 주시기 바랍니다.
한글목차
세계의 캡 애플리케이터 시장은 2025년에 7억 9,790만 달러로 추정되며, 2032년에는 10억 2,270만 달러에 달할 것으로 예측되며, 2025-2032년에 CAGR 3.6%로 성장할 것으로 예측됩니다.
보고서 범위
보고서 상세 내용
기준연도
2024년
2025년 시장 규모
7억 9,790만 달러
실적 데이터
2020-2024년
예측 기간
2025-2032년
예측 기간 : 2025-2032년 CAGR
3.60%
2032년 금액 예측
10억 2,270만 달러
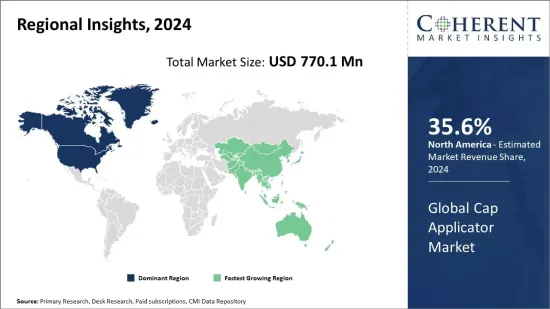
도표. 2025년 지역별 캡 어플리케이터 시장 점유율(%)
세계의 캡 어플리케이터 시장 성장은 제약 및 화장품 산업에서 캡 어플리케이터에 대한 엄청난 수요에 의해 주도되고 있습니다. 캡 어플리케이터는 병, 항아리, 튜브 및 기타 포장 용기에 캡이나 마개를 부착하는 데 사용됩니다. 이들은 포장의 미적 매력을 높이는 동시에 단단하고 누출 방지 밀봉을 보장하는 데 도움이 됩니다. 자동, 반자동, 수동 등 다양한 유형의 캡 어플리케이터가 생산량 및 선호하는 자동화 정도에 따라 사용할 수 있습니다. 효율성, 속도, 정확성을 향상시키는 혁신적인 캡핑 솔루션의 등장은 전체 제조 설정에서 캡 어플리케이터의 채택을 촉진할 수 있습니다.
시장 역학
세계 캡 어플리케이터 시장의 성장은 의약품 포장의 밀봉이 중요한 제약 산업에서 캡 어플리케이터에 대한 수요가 증가함에 따라 주도되고 있습니다. 화장품 및 퍼스널케어 산업의 성장과 매력적이고 안전하게 밀봉된 포장 솔루션에 대한 수요 증가도 시장 성장을 가속할 것입니다. 자동 캡 어플리케이터는 높은 초기 투자가 필요하므로 시장 성장에 걸림돌이 될 수 있습니다. 그러나 제조업체는 임대 및 임대 옵션을 통해 이를 해결하고 있습니다. 또한 고속화, 멀티 사이즈 기능, 검사 시스템과의 통합 등의 기능을 갖춘 스마트 캡 어플리케이터 개발을 위한 지속적인 기술 발전은 새로운 성장 기회를 제공할 수 있습니다. 제품 개발 중 캡 디자인 및 사이즈의 잦은 변경에 따른 높은 비용은 시장 개발에 걸림돌이 될 수 있습니다.
본 조사의 주요 특징
이 보고서는 세계의 캡 어플리케이터 시장을 상세하게 분석하여 2024년을 기준 연도로 하여 예측 기간(2025-2032년) 시장 규모와 연평균 성장률(CAGR%)을 게재하고 있습니다.
또한 다양한 부문에 걸친 잠재적 매출 기회를 파악하고 이 시장의 매력적인 투자 제안 매트릭스를 설명합니다.
또한 시장 성장 촉진요인, 억제요인, 기회, 신제품 출시 및 승인, 시장 동향, 지역별 전망, 주요 기업의 경쟁 전략 등에 대한 주요 인사이트를 제공합니다.
이 보고서는 기업 하이라이트, 제품 포트폴리오, 주요 하이라이트, 재무 성과, 전략 등의 매개 변수를 기반으로 세계의 캡 어플리케이터 시장에서 주요 기업을 프로파일링합니다.
이 보고서의 인사이트를 통해 마케팅 담당자와 기업 경영진은 향후 제품 출시, 유형 업그레이드, 시장 확대, 마케팅 전술에 대한 정보에 입각한 의사결정을 내릴 수 있을 것으로 보입니다.
세계의 캡 어플리케이터 시장 보고서는 투자자, 공급업체, 제품 제조업체, 유통업체, 신규 시장 진출기업, 재무 분석가 등 이 산업의 다양한 이해관계자를 대상으로 합니다.
이해관계자들은 세계 캡 어플리케이터 시장을 분석할 때 사용되는 다양한 전략 매트릭스를 통해 의사결정을 용이하게 할 수 있습니다.
목차
제1장 조사의 목적과 전제조건
조사 목적
전제조건
약어
제2장 시장 전망
리포트 설명
시장의 정의와 범위
개요
COM(Coherent Opportunity Map)
제3장 시장 역학, 규제, 동향 분석
시장 역학
촉진요인
억제요인
PEST 분석
Porter's Five Forces 분석
시장 기회
규제 시나리오
산업 동향
제4장 세계의 캡 애플리케이터 시장 - 코로나바이러스(COVID-19) 팬데믹의 영향
서론
세계의 캡 애플리케이터 시장에 영향을 미치는 요인 - COVID-19
영향 분석
제5장 세계의 캡 애플리케이터 시장, 유형별, 2020-2032년
서론
자동 캡 애플리케이터
반자동 캡 애플리케이터
수동 캡 애플리케이터
제6장 세계의 캡 애플리케이터 시장, 용도별, 2020-2032년
서론
식품 및 음료
의약품
화장품·퍼스널케어
기타
제7장 세계의 캡 애플리케이터 시장, 지역별, 2020-2032년
서론
북미
라틴아메리카
유럽
아시아태평양
중동
아프리카
제8장 경쟁 구도
히트맵 분석
시장 점유율 분석(3x3 매트릭스)
기업 개요
KHS Group
Sidel Group
Muller & Weigert GmbH
Cozzoli Machine Company
Accutek Packaging Equipment Companies, Inc.
Bottling Equipment
Pneumatic Scale Angelus
Aesus Packaging Systems
Tetra Pak
Fremont Machine Company
NPACK
Pack Tech
Universal Pack
Fachini
Mecapack
Inline Filling Systems
Zalkin
Serac
ProMach
CDA
제9장 애널리스트의 권장사항
운명의 수레바퀴
COM(Coherent Opportunity Map)
제10장 섹션
참고 문헌
조사 방법
KSA
영문 목차
영문목차
Global Cap Applicator Market is estimated to be valued at USD 797.9 Mn in 2025 and is expected to reach USD 1,022.7 Mn by 2032, growing at a compound annual growth rate (CAGR) of 3.6% from 2025 to 2032.
Report Coverage
Report Details
Base Year:
2024
Market Size in 2025:
USD 797.9 Mn
Historical Data for:
2020 To 2024
Forecast Period:
2025 To 2032
Forecast Period 2025 to 2032 CAGR:
3.60%
2032 Value Projection:
USD 1,022.7 Mn
Figure. Cap Applicator Market Share (%), By Region 2025
Global cap applicator market growth is driven by huge demand for cap applicator from the pharmaceutical and cosmetics industries. Cap applicators are used for applying caps or closures on bottles, jars, tubes, and other packaging containers. These helps ensure a tight and leak-proof sealing while also enhancing the aesthetic appeal of the packaging. Various types of cap applicators including automatic, semi-automatic, and manual variants are available depending on the production volumes and preferred degree of automation. Advent of innovative capping solutions oriented towards improved efficiency, speed, and accuracy can boost adoption of cap applicators across manufacturing setups.
Market Dynamics:
Global cap applicator market growth is driven by rising demand for cap applicator from the pharmaceutical industry, where hermetic sealing of medication packaging is crucial. Expansion of cosmetics and personal care industry along with rising need for attractive and securely sealed packaging solutions can also drive the market growth. High initial investment requirements for automated cap applicators can hamper the market growth. However, manufacturers are addressing this through rental and leasing options. Moreover, ongoing technological advancements aimed at the development of smart cap applicators with features such as increased speeds, multi-size capabilities, and integration with inspection systems can offer new growth opportunities. High costs involved with frequent changes to cap designs and sizes during product development can hamper the market growth.
Key features of the study:
This report provides in-depth analysis of the global cap applicator market, and provides market size (US$ Mn) and compound annual growth rate (CAGR%) for the forecast period (2025-2032), considering 2024 as the base year
It elucidates potential revenue opportunities across different segments and explains attractive investment proposition matrices for this market
This study also provides key insights about market drivers, restraints, opportunities, new product launches or approval, market trends, regional outlook, and competitive strategies adopted by key players
It profiles key players in the global cap applicator market based on the following parameters - company highlights, products portfolio, key highlights, financial performance, and strategies
Key companies covered as a part of this study include KHS Group, Sidel Group, Muller & Weigert GmbH, Cozzoli Machine Company, Accutek Packaging Equipment Companies, Inc., Bottling Equipment, Pneumatic Scale Angelus, Aesus Packaging Systems, Tetra Pak, Fremont Machine Company, NPACK, Pack Tech, Universal Pack, Fachini, Mecapack, Inline Filling Systems, Zalkin, Serac, ProMach, and CDA
Insights from this report would allow marketers and the management authorities of the companies to make informed decisions regarding their future product launches, type up-gradation, market expansion, and marketing tactics.
Global cap applicator market report caters to various stakeholders in this industry including investors, suppliers, product manufacturers, distributors, new entrants, and financial analysts
Stakeholders would have ease in decision-making through various strategy matrices used in analyzing the global cap applicator market