Composable Infrastructure Market, By Type, By Enterprise Size, By Industry Vertical, By Geography
상품코드:1673876
리서치사:Coherent Market Insights
발행일:2025년 02월
페이지 정보:영문
라이선스 & 가격 (부가세 별도)
ㅁ Add-on 가능: 고객의 요청에 따라 일정한 범위 내에서 Customization이 가능합니다. 자세한 사항은 문의해 주시기 바랍니다.
한글목차
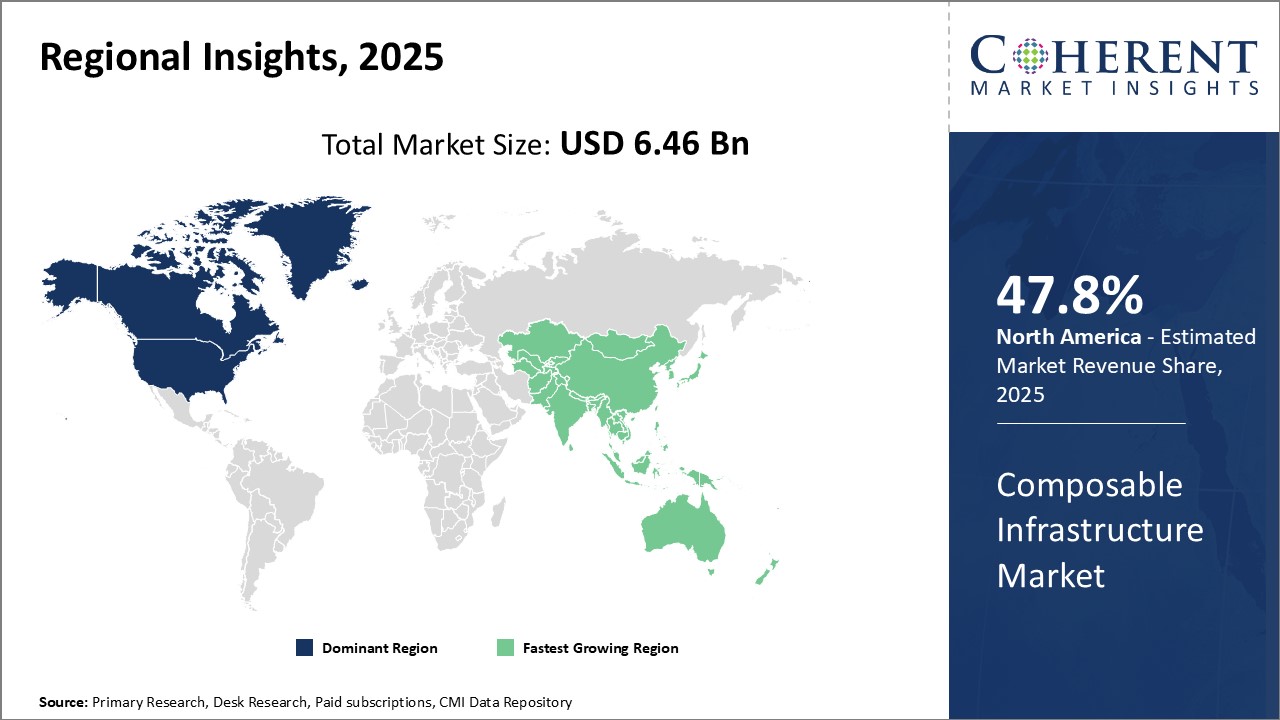
컴포저블 인프라 세계 시장 규모는 2025년에 64억 6,000만 달러, 2032년에는 230억 4,000만 달러에 달할 것으로 추정되며, 2025년부터 2032년까지 연평균 19.9% 성장할 것으로 예상됩니다.
보고 범위
보고서 상세 내용
기준 연도
2024년
2025년 시장 규모
64억 6,000만 달러
실적 데이터
2020-2024년
예측 기간
2025-2032년
예측 기간(2025-2032년) CAGR
19.90%
2032년 가치 예측
230억 4,000만 달러
그림. 2025년 지역별 컴포저블 인프라 시장 점유율(%)
보고서 개요
컴포저블 인프라는 하드웨어와 소프트웨어 리소스를 서로 분리하여 비즈니스 요구에 따라 동적으로 연동할 수 있도록 하는 데이터센터 인프라에 대한 새로운 접근 방식입니다. 컴포저블 인프라는 기반 인프라를 추상화하고 컴퓨팅, 스토리지, 네트워크 등의 자원을 개별 서비스로 공개하여 필요에 따라 임의의 용도 구성으로 통합할 수 있도록 하는 것을 목표로 합니다. 이를 통해 데이터센터 운영에 유연성과 효율성을 제공합니다. 컴포저블 인프라를 채택함으로써 벤더 종속성을 없애고, 리소스 활용을 최적화하며, 종량제 운영 모델로 용도를 신속하게 제공할 수 있을 것으로 기대됩니다.
시장 역학
컴포저블 인프라 시장의 성장을 가속하는 주요 요인으로는 확장 가능하고 효율적인 인프라에 대한 수요 증가, 최적의 리소스 활용에 대한 요구 증가, 용도 중심 인프라 구축에 대한 의지, 용도 도입 기간 단축 등을 들 수 있습니다. 그러나 레거시 인프라에 대한 투자, 숙련된 인력 부족, 인프라 추상화에 따른 보안 우려 등의 문제로 인해 이 새로운 기술의 채택을 억제하고 있습니다. 컴포저블 인프라 제공업체들은 동적 리소스 할당 및 신속한 용도 프로비저닝과 같은 기능이 중요한 엣지 컴퓨팅 환경에서 비즈니스 기회를 모색하고 있습니다. 또한, 컴포저블 인프라 공급업체와 클라우드 서비스 제공업체와의 파트너십도 이 솔루션이 대응할 수 있는 시장을 확대하고 있습니다.
본 조사의 주요 특징
본 보고서는 컴포저블 인프라 세계 시장을 상세하게 분석했으며, 2024년을 기준 연도로 하여 예측 기간(2025-2032년) 시장 규모와 연평균 성장률(CAGR)을 조사하여 전해드립니다.
또한, 다양한 부문에 걸친 잠재적인 수익 성장 기회를 밝히고, 이 시장의 매력적인 투자 제안 매트릭스를 설명합니다.
또한 시장 성장 촉진요인, 억제요인, 기회, 신제품 출시 및 승인, 시장 동향, 지역별 전망, 주요 기업의 경쟁 전략 등에 대한 중요한 고찰을 제공합니다.
이 보고서는 기업 하이라이트, 제품 포트폴리오, 주요 하이라이트, 재무 성과, 전략 등의 매개 변수를 기반으로 세계 컴포저블 인프라 시장의 주요 기업을 프로파일링합니다.
이 보고서의 통찰력을 통해 마케팅 담당자와 기업 경영진은 향후 제품 출시, 유형화, 시장 확대, 마케팅 전략에 대한 정보에 입각한 의사결정을 내릴 수 있습니다.
컴포저블 인프라 세계 시장 보고서는 투자자, 공급업체, 제품 제조업체, 유통업체, 신규 시장 진출기업, 재무 분석가 등 다양한 이해관계자를 대상으로 합니다.
이해관계자들은 세계 컴포저블 인프라 시장 분석에 사용되는 다양한 전략 매트릭스를 통해 의사결정을 용이하게 할 수 있습니다.
목차
제1장 조사 목적과 전제조건
조사 목적
전제조건
약어
제2장 시장 전망
보고서 설명
시장 정의와 범위
주요 요약
Coherent Opportunity Map(COM)
제3장 시장 역학, 규제, 동향 분석
시장 역학
성장 촉진요인
성장 억제요인
기회
규제 시나리오
업계 동향
인수합병(M&A)
신시스템 시작/승인
COVID-19 팬데믹의 영향
제4장 세계의 컴포저블 인프라 시장, 유형별, 2020년-2032년
소프트웨어
하드웨어
제5장 세계 컴포저블 인프라 시장, 기업 규모별, 2020년-2032년
대기업
중소기업
제6장 세계의 컴포저블 인프라 시장, 업계별, 2020년-2032년
은행, 금융서비스 및 보험(BFSI)
IT 및 통신
소매 및 소비재
헬스케어
제조업
기타
제7장 세계의 컴포저블 인프라 시장, 지역별, 2020년-2032년
북미
유럽
아시아태평양
라틴아메리카
중동 및 아프리카
제8장 경쟁 구도
기업 개요
Cloudistics
Dell EMC
Drivescale
HGST
HPE
Lenovo
Liqid
One Stop Systems
QCT
Tidalscale
DriveScale
TidalScale
OSS
Dolphin ICS
Inspur
Western Digital Corporation
Hewlett Packard Enterprise Development LP
Quanta Computer Inc.
Kaminario Flex.
Wipro Limited
제9장 애널리스트 추천 사항
기회
애널리스트의 견해
Coherent Opportunity Map
제10장 조사 방법
참고 문헌
조사 방법
LSH
영문 목차
영문목차
Global Composable Infrastructure Market is estimated to be valued at USD 6.46 Bn in 2025 and is expected to reach USD 23.04 Bn by 2032, growing at a compound annual growth rate (CAGR) of 19.9% from 2025 to 2032.
Report Coverage
Report Details
Base Year:
2024
Market Size in 2025:
USD 6.46 Bn
Historical Data for:
2020 To 2024
Forecast Period:
2025 To 2032
Forecast Period 2025 to 2032 CAGR:
19.90%
2032 Value Projection:
USD 23.04 Bn
Figure. Composable Infrastructure Market Share (%), By Region 2025
Report Description:
Composable infrastructure is an emerging approach to data center infrastructure that separates hardware and software resources from each other to allow them to work together dynamically based on business needs. It aims to abstract the underlying infrastructure and expose resources like compute, storage, and networking as individual services that can be aggregated into any application configuration on demand. This brings more flexibility and efficiency to data center operations. Adoption of composable infrastructure is expected to help organizations eliminate vendor lock-ins, optimize resource utilization, and deliver applications faster with pay-as-you-go operational model.
Market Dynamics:
The key drivers favoring the growth of the composable infrastructure market include increasing demand for scalable and efficient infrastructure, growing need for optimal resource utilization, desire to build application-centric infrastructure, and reduce time to deploy applications. However, factors like legacy infrastructure investments, lack of skilled workforce, and security concerns associated with infrastructure abstraction are challenges restraining the adoption of this new technology. Composable infrastructure providers are exploring opportunities in edge computing environments where capabilities like dynamic resource allocation and quick application provisioning would be critical. Partnerships between composable infrastructure vendors and cloud service providers are also expanding the addressable market for this solution.
Key features of the study:
This report provides an in-depth analysis of the global composable infrastructure market, and provides market size (US$ Billion) and compound annual growth rate (CAGR %) for the forecast period (2025-2032), considering 2024 as the base year.
It elucidates potential revenue growth opportunities across different segments and explains attractive investment proposition matrices for this market.
This study also provides key insights about market drivers, restraints, opportunities, new product launches or approvals, market trends, regional outlook, and competitive strategies adopted by key players.
It profiles key players in the global composable infrastructure market based on the following parameters - company highlights, products portfolio, key highlights, financial performance, and strategies.
Key companies covered as a part of this study include Cloudistics, Dell EMC, Drivescale, HGST, HPE, Lenovo, Liqid, One Stop Systems, QCT, Tidalscale, DriveScale, TidalScale, OSS, Dolphin ICS, Inspur, Western Digital Corporation, Hewlett Packard Enterprise Development LP, Quanta Computer Inc., and Kaminario Flex.
Insights from this report would allow marketers and the management authorities of the companies to make informed decisions regarding their future product launches, type up-gradation, market expansion, and marketing tactics.
The global composable infrastructure market report caters to various stakeholders in this industry including investors, suppliers, product manufacturers, distributors, new entrants, and financial analysts.
Stakeholders would have ease in decision-making through various strategy matrices used in analyzing the global composable infrastructure market.
Detailed Segmentation-
By Type
Software
Hardware
By Enterprise Size
Large Enterprises
Small & Medium Enterprises
By Industry Vertical
BFSI
IT & Telecom
Retail & Consumer Goods
Healthcare
Manufacturing
Others
By Regional
North America
Europe
Asia Pacific
Latin America
Middle East
Africa
Key Players
Cloudistics
Dell EMC
Drivescale
HGST
HPE
Lenovo
Liqid
One Stop Systems
QCT
Tidalscale
DriveScale
TidalScale
OSS
Dolphin ICS
Inspur
Western Digital Corporation
Hewlett Packard Enterprise Development LP
Quanta Computer Inc.
Kaminario Flex.
Table of Contents
1. Research Objectives and Assumptions
Research Objectives
Assumptions
Abbreviations
2. Market Purview
Report Description
Market Definition and Scope
Executive Summary
Market Snippet, By Type
Market Snippet, By Enterprise Size
Market Snippet, By Industry Vertical
Market Snippet, By Region
Coherent Opportunity Map (COM)
3. Market Dynamics, Regulations, and Trends Analysis
Market Dynamics
Drivers
Restraints
Opportunities
Regulatory Scenario
Industry Trend
Merger and Acquisitions
New system Launch/Approvals
Impact of the COVID-19 Pandemic
4. Global Composable Infrastructure Market, By Type, 2020-2032, (US$ Billion)
Introduction
Market Share Analysis, 2025 and 2032 (%)
Y-o-Y Growth Analysis, 2020-2032
Segment Trends
Software
Introduction
Market Size and Forecast, 2020-2032, (US$ Billion)
Hardware
Introduction
Market Size and Forecast, 2020-2032, (US$ Billion)
5. Global Composable Infrastructure Market, By Enterprise Size, 2020-2032, (US$ Billion)
Introduction
Market Share Analysis, 2025 and 2032 (%)
Y-o-Y Growth Analysis, 2020-2032
Segment Trends
Large Enterprises
Introduction
Market Size and Forecast, 2020-2032, (US$ Billion)
Small & Medium Enterprises
Introduction
Market Size and Forecast, 2020-2032, (US$ Billion)
6. Global Composable Infrastructure Market, By Industry Vertical, 2020-2032, (US$ Billion)
Introduction
Market Share Analysis, 2025 and 2032 (%)
Y-o-Y Growth Analysis, 2020-2032
Segment Trends
BFSI
Introduction
Market Size and Forecast, 2020-2032, (US$ Billion)
IT & Telecom
Introduction
Market Size and Forecast, 2020-2032, (US$ Billion)
Retail & Consumer Goods
Introduction
Market Size and Forecast, 2020-2032, (US$ Billion)
Healthcare
Introduction
Market Size and Forecast, 2020-2032, (US$ Billion)
Manufacturing
Introduction
Market Size and Forecast, 2020-2032, (US$ Billion)
Others
Introduction
Market Size and Forecast, 2020-2032, (US$ Billion)
7. Global Composable Infrastructure Market, By Region, 2020-2032, (US$ Billion)
Introduction
Market Share Analysis, By Region, 2025 and 2032 (%)
Y-o-Y Growth Analysis, 2020-2032
North America
Regional Trends
Market Size and Forecast, By Type, 2020-2032, (US$ Billion)
Market Size and Forecast, By Enterprise Size, 2020-2032, (US$ Billion)
Market Size and Forecast, By Industry Vertical, 2020-2032, (US$ Billion)
Market Size and Forecast, By Country, 2020-2032, (US$ Billion)
U.S.
Canada
Europe
Regional Trends
Market Size and Forecast, By Type, 2020-2032, (US$ Billion)
Market Size and Forecast, By Enterprise Size, 2020-2032, (US$ Billion)
Market Size and Forecast, By Industry Vertical, 2020-2032, (US$ Billion)
Market Size and Forecast, By Country, 2020-2032, (US$ Billion)
U.K.
Germany
Italy
France
Russia
Rest of Europe
Asia Pacific
Regional Trends
Market Size and Forecast, By Type, 2020-2032, (US$ Billion)
Market Size and Forecast, By Enterprise Size, 2020-2032, (US$ Billion)
Market Size and Forecast, By Industry Vertical, 2020-2032, (US$ Billion)
Market Size and Forecast, By Country, 2020-2032, (US$ Billion)
China
India
ASEAN
Australia
South Korea
Japan
Rest of Asia Pacific
Latin America
Regional Trends
Market Size and Forecast, By Type, 2020-2032, (US$ Billion)
Market Size and Forecast, By Enterprise Size, 2020-2032, (US$ Billion)
Market Size and Forecast, By Industry Vertical, 2020-2032, (US$ Billion)
Market Size and Forecast, By Country, 2020-2032, (US$ Billion)
Brazil
Argentina
Mexico
Rest of Latin America
Middle East & Africa
Regional Trends
Market Size and Forecast, By Type, 2020-2032, (US$ Billion)
Market Size and Forecast, By Enterprise Size, 2020-2032, (US$ Billion)
Market Size and Forecast, By Industry Vertical, 2020-2032, (US$ Billion)
Market Size and Forecast, By Country, 2020-2032, (US$ Billion)