Directional Drilling Solutions & Services Market, By Type, By Technology, By Application, By Geography
상품코드:1673029
리서치사:Coherent Market Insights
발행일:2025년 02월
페이지 정보:영문
라이선스 & 가격 (부가세 별도)
ㅁ Add-on 가능: 고객의 요청에 따라 일정한 범위 내에서 Customization이 가능합니다. 자세한 사항은 문의해 주시기 바랍니다.
한글목차
세계 방향성 시추 솔루션 및 서비스 시장은 2025년에 141억 5,000만 달러, 2032년에는 247억 3,000만 달러에 달할 것으로 예상되며 2025년부터 2032년까지 연평균 8.3% 성장할 것으로 예상됩니다.
보고 범위
보고서 상세 내용
기준 연도
2024년
2025년 시장 규모
141억 5,000만 달러
실적 데이터
2020-2024년
예측 기간
2025-2032년
예측 기간(2025-2032년) CAGR
8.30%
2032년 가치 예측
247억 3,000만 달러
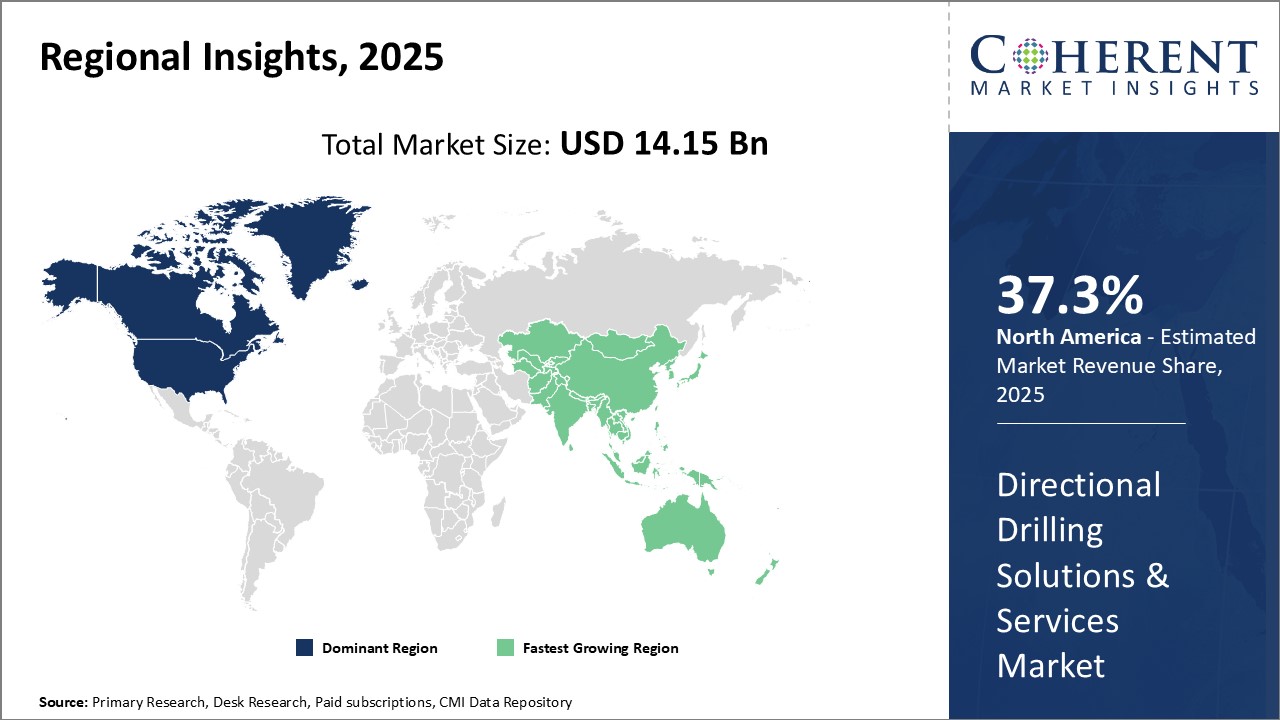
그림. 2025년 지역별 방향성 시추 솔루션 및 서비스 시장 점유율(%)
방향성 시추 기술은 목표 지층을 따라 유정을 수평으로 유도할 수 있도록 함으로써 석유 및 가스정 건설에 혁명을 일으켰습니다. 첨단 경사 시추 솔루션과 서비스를 통해 운영자는 저류층에서 생산량을 극대화하고 지표면 설치 면적을 최소화할 수 있습니다. 회전식 조향 시스템 및 측정 시추 도구와 같은 기술은 정확한 우물 배치와 실시간 시추 파라미터를 제공하여 방향성 우물 설계를 최적화합니다.
시장 역학
세계 경사 시추 솔루션 및 서비스 시장은 긴 측면 우물 섹션, 다측면 우물 시추, 초심해 시추를 수반하는 석유 및 가스전 개발 프로젝트의 복잡성 증가에 의해 주도되고 있습니다. 방향성 시추는 셰일 분지와 같은 조밀한 지층에 갇혀 있는 매장량을 발굴하는 데 도움이 됩니다. 그러나 높은 장비 비용과 운영 비용이 문제이며, 에너지 가격 변동은 해양 및 비전통 석유 및 가스 프로젝트에 영향을 미칩니다. 시추 효율을 개선하기 위한 자동화 및 데이터 분석에 기회가 있습니다.
본 조사의 주요 특징
세계의 방향성 시추 솔루션 및 서비스 시장을 상세하게 분석하여 2024년을 기준 연도로 하여 예측 기간(2025-2032년) 시장 규모와 연평균 성장률(CAGR%)을 조사하여 전해드립니다.
또한, 다양한 부문에 걸친 잠재적 수익 창출 기회를 파악하고, 이 시장의 매력적인 투자 제안 매트릭스를 설명합니다.
또한 시장 성장 촉진요인, 억제요인, 기회, 신제품 출시 및 승인, 시장 동향, 지역별 전망, 주요 기업의 경쟁 전략 등에 대한 주요 고찰을 제공합니다.
세계 방향성 시추 솔루션 및 서비스 시장의 주요 기업들을 기업 하이라이트, 제품 포트폴리오, 주요 하이라이트, 실적, 전략 등의 매개 변수를 기반으로 프로파일링합니다.
주요 기업으로는 Schlumberger Limited, Halliburton Company, Baker Hughes Company, National Oilwell Varco, Inc. Nabors Industries Ltd.,Patterson-UTI Energy, Inc.,TechnipFMC plc,Aker Solutions ASA,Ensign Energy Services Inc. Drilling Corporation, KCA Deutag, Step Energy Services Ltd., GDI Integrated Facility Services Inc. 등이 있습니다.
이 보고서의 통찰력을 통해 마케팅 담당자와 기업 경영진은 향후 제품 출시, 유형화, 시장 확대, 마케팅 전략에 대한 정보에 입각한 의사결정을 내릴 수 있습니다.
이 보고서는 투자자, 공급업체, 제품 제조업체, 유통업체, 신규 시장 진출기업, 재무 분석가 등 업계의 다양한 이해관계자를 대상으로 합니다.
이해관계자들은 세계 경사굴착 솔루션 및 서비스 시장 분석에 사용되는 다양한 전략 매트릭스를 통해 의사결정을 용이하게 할 수 있습니다.
목차
제1장 조사 목적과 전제조건
조사 목적
전제조건
약어
제2장 시장 전망
보고서 설명
시장 정의와 범위
주요 요약
제3장 시장 역학, 규제, 동향 분석
시장 역학
성장 촉진요인
성장 억제요인
시장 기회
규제 시나리오
업계 동향
인수합병(M&A)
새로운 시스템 도입/승인
COVID-19 팬데믹의 영향
제4장 세계의 방향성 시추 솔루션 및 서비스 시장, 유형별, 2020년-2032년
장비
서비스
제5장 세계의 방향성 시추 솔루션 및 서비스 시장, 기술별, 2020년-2032년
회전 조타 시스템(RSS)
기존 방향성 시추
MPD(Managed Pressure Drilling)
제6장 세계의 방향성 시추 솔루션 및 서비스 시장, 용도별, 2020년-2032년
석유 및 가스
광업
건설
유틸리티
기타
제7장 세계의 방향성 시추 솔루션 및 서비스 시장, 지역별, 2020년-2032년
북미
유럽
아시아태평양
라틴아메리카
중동
아프리카
제8장 경쟁 구도
기업 개요
Schlumberger Limited
Halliburton Company
Baker Hughes Company
National Oilwell Varco, Inc.
Weatherford International plc
Nabors Industries Ltd.
Patterson-UTI Energy, Inc.
TechnipFMC plc
Aker Solutions ASA
Ensign Energy Services Inc.
Transocean Ltd.
Precision Drilling Corporation
KCA Deutag
Step Energy Services Ltd.
GDI Integrated Facility Services Inc.
제9장 애널리스트 추천 사항
기회
애널리스트의 견해
Coherent Opportunity Map
제10장 조사 방법
참고 문헌
조사 방법
LSH
영문 목차
영문목차
Global Directional Drilling Solutions & Services Market is estimated to be valued at USD 14.15 Bn in 2025 and is expected to reach USD 24.73 Bn by 2032, growing at a compound annual growth rate (CAGR) of 8.3% from 2025 to 2032.
Report Coverage
Report Details
Base Year:
2024
Market Size in 2025:
USD 14.15 Bn
Historical Data for:
2020 To 2024
Forecast Period:
2025 To 2032
Forecast Period 2025 to 2032 CAGR:
8.30%
2032 Value Projection:
USD 24.73 Bn
Figure. Directional Drilling Solutions & Services Market Share (%), By Region 2025
Directional drilling has revolutionized the construction of oil and gas wells by enabling wellbores to be steered horizontally along target geological formations. Advanced Directional Drilling Solutions & Services allow operators to maximize production from reservoirs and minimize surface footprints. Technologies such as rotary steerable systems and measurement-while-drilling tools provide precise wellbore placement and real-time drilling parameters to optimize directional well designs.
Market Dynamics:
The global Directional Drilling Solutions & Services market is driven by the increasing complexity of oil and gas field development projects involving long lateral well sections, multilateral well bores, and ultra-deepwater drilling. Directional drilling helps unlock reserves trapped in tight formations like shale basins. However, high equipment and operational costs pose challenges, while volatile energy prices impact offshore and unconventional oil & gas projects. Opportunities lie in automation and data analytics to improve drilling efficiency.
Key Features of the Study:
This report provides in-depth analysis of the global directional drilling solutions and services market, and provides market size (US$ Bn) and compound annual growth rate (CAGR%) for the forecast period (2025-2032), considering 2024 as the base year
It elucidates potential revenue opportunities across different segments and explains attractive investment proposition matrices for this market
This study also provides key insights about market drivers, restraints, opportunities, new product launches or approvals, market trends, regional outlook, and competitive strategies adopted by key players
It profiles key players in the global Directional Drilling Solutions & Services market based on the following parameters - company highlights, products portfolio, key highlights, financial performance, and strategies
Key companies covered as a part of this study include Schlumberger Limited, Halliburton Company, Baker Hughes Company, National Oilwell Varco, Inc., Weatherford International plc, Nabors Industries Ltd., Patterson-UTI Energy, Inc., TechnipFMC plc, Aker Solutions ASA, Ensign Energy Services Inc., Transocean Ltd., Precision Drilling Corporation, KCA Deutag, Step Energy Services Ltd., and GDI Integrated Facility Services Inc.
Insights from this report would allow marketers and the management authorities of the companies to make informed decisions regarding their future product launches, type up-gradation, market expansion, and marketing tactics
The global Directional Drilling Solutions & Services market report caters to various stakeholders in this industry including investors, suppliers, product manufacturers, distributors, new entrants, and financial analysts
Stakeholders would have ease in decision-making through various strategy matrices used in analyzing the global Directional Drilling Solutions & Services market