Carbon Capture and Storage Market, By Technology, By Application, By Service, By Geography
상품코드:1672987
리서치사:Coherent Market Insights
발행일:2025년 02월
페이지 정보:영문
라이선스 & 가격 (부가세 별도)
ㅁ Add-on 가능: 고객의 요청에 따라 일정한 범위 내에서 Customization이 가능합니다. 자세한 사항은 문의해 주시기 바랍니다.
한글목차
세계 탄소 포집 및 저장(CCS) 시장은 2025년 67억 3,000만 달러, 2032년에는 154억 6,000만 달러에 달할 것으로 예측되며, 2025년부터 2032년까지 연평균 12.6%의 성장률을 나타낼 것으로 예상됩니다.
보고 범위
보고서 상세 내용
기준 연도
2024년
2025년 시장 규모
67억 3,000만 달러
실적 데이터
2020-2024년
예측 기간
2025-2032년
예측 기간(2025-2032년) CAGR
12.60%
2032년 금액 예측
154억 6,000만 달러
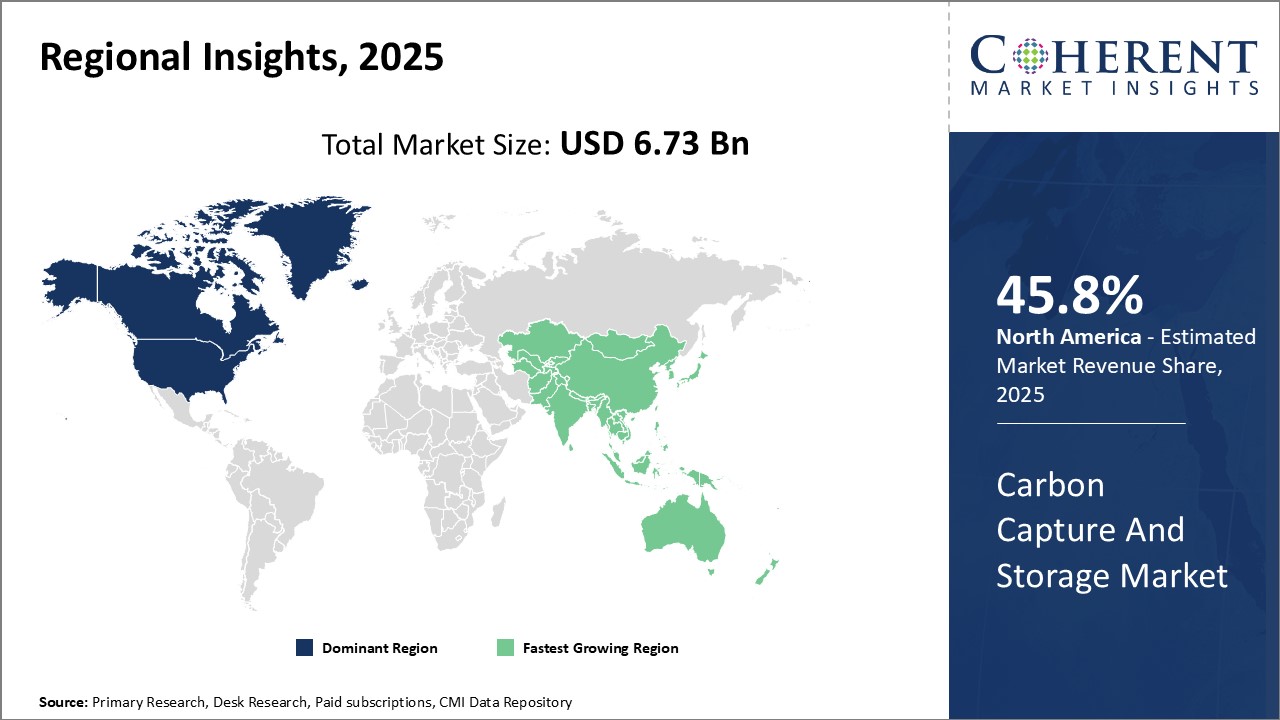
그림. 2025년 지역별 탄소 포집 및 저장(CCS) 시장 점유율(%)
보고서 개요
탄소 포집 및 저장(CCS)은 발전, 제조 등 산업 공정에서 배출되는 이산화탄소(CO2)를 크게 줄일 수 있는 일련의 기술로, 화석연료 발전소와 같은 대규모 점오염원으로부터 CO2를 회수하여 파이프라인이나 선박을 통해 수송한 후 깊은 지층에 저장하여 대기 중으로 배출하지 않도록 하는 기술입니다. 대기 중으로 배출하지 않습니다.
석탄 화력 발전소, 가스 화력 발전소 및 산업 사업장에 CCS를 도입함으로써 기업은 온실 가스 배출을 크게 줄일 수 있습니다. CCS는 장기적인 기후 변화 목표를 달성하고 향후 수십년동안 석탄 화력에 대한 의존도를 줄이는 데 중요한 역할을 할 수 있는 과도기적 기술입니다.
시장 역학
세계 탄소 포집 및 저장(CCS) 시장은 파리 협정에서 정한 정부의 엄격한 지침과 탄소 배출량 감축 목표에 의해 주도되고 있습니다. 많은 국가들이 탄소 가격제와 같은 정책을 시행하여 탄소 배출이 많은 산업에서 탄소 회수 프로젝트에 인센티브를 부여하고 있습니다. 그러나 CCS 기술 개발 및 보급과 관련된 높은 비용이 큰 걸림돌로 작용하고 있습니다. 완전히 통합된 CCS 프로젝트의 비용은 수십억 달러에 달할 전망입니다. 또한, 장기적인 탄소 저장의 불확실성과 불투명한 규제가 문제점으로 지적되고 있습니다. 긍정적인 측면은 CCS를 통해 화석연료 전력의 평준화 비용을 낮추는 것에 대한 관심이 높아지고 있다는 점입니다. 여러 파일럿 프로젝트와 실증 실험이 전 세계적으로 CCS의 규모를 확대하고 있으며, CO2 수송 및 저장을 위한 표준화된 프레임워크의 개발도 시장 성장 전망에 힘을 실어줄 수 있습니다.
본 조사의 주요 특징
세계의 탄소 포집 및 저장(CCS) 시장을 상세하게 분석하여 2024년을 기준 연도로 하여 예측 기간(2025-2032년) 시장 규모와 연평균 성장률(CAGR%)을 조사 분석하여 전해드립니다.
또한, 다양한 부문에 걸친 잠재적인 수익 성장 기회를 밝히고, 이 시장의 매력적인 투자 제안 매트릭스를 설명합니다.
또한 시장 성장 촉진요인, 억제요인, 기회, 신제품 출시 및 승인, 시장 동향, 지역별 전망, 주요 기업의 경쟁 전략 등에 대한 주요 고찰을 제공합니다.
이 보고서는 기업 하이라이트, 제품 포트폴리오, 주요 하이라이트, 재무 성과, 전략 등의 매개 변수를 기반으로 세계 탄소 포집 및 저장(CCS) 시장의 주요 기업을 프로파일링합니다.
주요 기업으로는 Honeywell International Inc., Schlumberger Limited, Aker Solutions, Dakota Gasification Company, Siemens Energy, Sulzer Ltd. Japan CCS Co., Ltd., LanzaTech, Shell PLC, Linde plc, Mitsubishi Heavy Industries, Equinor ASA, Exxon Mobil Corporation, Carbon Engineering Ltd. Fluor Corporation 등이 있습니다.
이 보고서의 통찰력을 통해 마케팅 담당자와 기업 경영진은 향후 제품 출시, 유형 업그레이드, 시장 확대, 마케팅 전술에 대한 정보에 입각한 의사결정을 내릴 수 있습니다.
이 보고서는 투자자, 공급업체, 제품 제조업체, 유통업체, 신규 시장 진출기업, 재무 분석가 등 이 산업의 다양한 이해관계자를 대상으로 합니다.
이해관계자들은 세계 탄소 포집 및 저장(CCS) 시장 분석에 사용되는 다양한 전략 매트릭스를 통해 의사결정을 용이하게 할 수 있습니다.
목차
제1장 조사 목적과 전제조건
조사 목적
전제조건
약어
제2장 시장 전망
보고서 설명
시장 정의와 범위
주요 요약
Coherent Opportunity Map (COM)
제3장 시장 역학, 규제, 동향 분석
시장 역학
성장 촉진요인
성장 억제요인
기회
규제 시나리오
산업 동향
인수합병(M&A)
새로운 시스템 도입/승인
COVID-19 팬데믹의 영향
제4장 세계의 탄소 포집 및 저장(CCS) 시장, 기술별, 2020-2032년
서론
연소 전
연소 후
산소 연소
제5장 세계의 탄소 포집 및 저장(CCS) 시장, 용도별, 2020-2032년
서론
석유 및 가스
발전
철강
화학제품 및 석유화학제품
시멘트
기타
제6장 세계의 탄소 포집 및 저장(CCS) 시장, 서비스별, 2020-2032년
서론
포집
운송
이용
저장
제7장 세계의 탄소 포집 및 저장(CCS) 시장, 지역별, 2020-2032년
서론
북미
유럽
아시아태평양
라틴아메리카
중동 및 아프리카
제8장 경쟁 구도
기업 개요
Honeywell International Inc.
Schlumberger Limited
Aker Solutions
Dakota Gasification Company
Siemens Energy
Sulzer Ltd.
Japan CCS Co., Ltd.
LanzaTech
Shell PLC
Linde plc
Mitsubishi Heavy Industries
Equinor ASA
Exxon Mobil Corporation
Carbon Engineering Ltd.
Fluor Corporation
제9장 애널리스트 추천 사항
융성과 쇠퇴
Coherent Opportunity Map
제10장 조사 방법
참고 문헌
조사 방법
LSH
영문 목차
영문목차
Global Carbon Capture And Storage Market is estimated to be valued at USD 6.73 Bn in 2025 and is expected to reach USD 15.46 Bn by 2032, growing at a compound annual growth rate (CAGR) of 12.6% from 2025 to 2032.
Report Coverage
Report Details
Base Year:
2024
Market Size in 2025:
USD 6.73 Bn
Historical Data for:
2020 To 2024
Forecast Period:
2025 To 2032
Forecast Period 2025 to 2032 CAGR:
12.60%
2032 Value Projection:
USD 15.46 Bn
Figure. Carbon Capture And Storage Market Share (%), By Region 2025
Report Description:
Carbon capture and storage (CCS) is a set of technologies that can greatly reduce carbon dioxide (CO2) emissions from industrial processes like electricity generation and manufacturing. CCS involves capturing CO2 from large point sources like fossil fuel power plants, transporting it via pipelines or ships, and storing it in deep geological formations so that it does not enter the atmosphere.
By deploying CCS at coal- and gas-fired power plants and industrial operations, companies can significantly curb their greenhouse gas emissions. This enables them to continue using fossil fuels as an energy source while transitioning to cleaner alternatives. CCS thus represents a transitional technology that could play a key role in achieving long-term climate goals and reducing reliance on coal power in the coming decades.
Market Dynamics:
The global carbon capture and storage market is driven by stringent government mandates and carbon emission reduction targets set forth in the Paris Agreement. Many countries are implementing policies like carbon pricing and incentives for carbon capture projects in high-emitting industries. However, high costs associated with CCS technology development and deployment act as a major restraint. The complete cost of a fully-integrated CCS project amounts to billions of dollars. Moreover, uncertainty over long-term carbon storage and unclear regulations pose challenges. On the positive side, increasing focus on lowering the levelized cost of electricity from fossil fuels through CCS presents an opportunity. Several pilot projects and demonstrations are scaling up CCS globally. Developing standardized frameworks for the transport and storage of CO2 can also boost market growth prospects.
Key features of the study:
This report provides an in-depth analysis of the global carbon capture and storage market, and provides market size (US$ Billion) and compound annual growth rate (CAGR %) for the forecast period (2025-2032), considering 2024 as the base year
It elucidates potential revenue growth opportunities across different segments and explains attractive investment proposition matrices for this market
This study also provides key insights about market drivers, restraints, opportunities, new product launches or approvals, market trends, regional outlook, and competitive strategies adopted by key players
It profiles key players in the global carbon capture and storage market based on the following parameters - company highlights, products portfolio, key highlights, financial performance, and strategies
Key companies covered as a part of this study include Honeywell International Inc., Schlumberger Limited, Aker Solutions, Dakota Gasification Company, Siemens Energy, Sulzer Ltd., Japan CCS Co., Ltd., LanzaTech, Shell PLC, Linde plc, Mitsubishi Heavy Industries, Equinor ASA, Exxon Mobil Corporation, Carbon Engineering Ltd., and Fluor Corporation
Insights from this report would allow marketers and the management authorities of the companies to make informed decisions regarding their future product launches, type up-gradation, market expansion, and marketing tactics
The global carbon capture and storage market report caters to various stakeholders in this industry including investors, suppliers, product manufacturers, distributors, new entrants, and financial analysts
Stakeholders would have ease in decision-making through various strategy matrices used in analyzing the global carbon capture and storage market
Market Segmentation
By Technology
Pre-combustion
Post-combustion
Oxy-fuel Combustion
By Application
Oil and Gas
Power Generation
Iron and Steel
Chemical and Petrochemical
Cement
Others
By Service
Capture
Transportation
Utilization
Storage
By Regional
North America
Latin America
Europe
Asia Pacific
Middle East & Africa
Key Players Insights
Honeywell International Inc.
Schlumberger Limited
Aker Solutions
Dakota Gasification Company
Siemens Energy
Sulzer Ltd.
Japan CCS Co., Ltd.
LanzaTech
Shell PLC
Linde plc
Mitsubishi Heavy Industries
Equinor ASA
Exxon Mobil Corporation
Carbon Engineering Ltd.
Fluor Corporation
Table of Contents
1. Research Objectives and Assumptions
Research Objectives
Assumptions
Abbreviations
2. Market Purview
Report Description
Market Definition and Scope
Executive Summary
Market Snippet, By Technology
Market Snippet, By Application
Market Snippet, By Service
Market Snippet, By Region
Coherent Opportunity Map (COM)
3. Market Dynamics, Regulations, and Trends Analysis
Market Dynamics
Drivers
Restraints
Opportunities
Regulatory Scenario
Industry Trend
Merger and Acquisitions
New System Launches/Approvals
Impact of the COVID-19 Pandemic
4. Global Carbon Capture and Storage Market, By Technology, 2020-2032 (US$ Billion)
Introduction
Market Share Analysis, 2025 and 2032 (%)
Y-o-Y Growth Analysis, 2021-2032
Segment Trends
Pre-combustion
Introduction
Market Size and Forecast, 2020-2032, (US$ Billion)
Post-combustion
Introduction
Market Size and Forecast, 2020-2032, (US$ Billion)
Oxy-fuel Combustion
Introduction
Market Size and Forecast, 2020-2032, (US$ Billion)
5. Global Carbon Capture and Storage Market, By Application, 2020-2032 (US$ Billion)
Introduction
Market Share Analysis, 2025 and 2032 (%)
Y-o-Y Growth Analysis, 2021-2032
Segment Trends
Oil and Gas
Introduction
Market Size and Forecast, 2020-2032, (US$ Billion)
Power Generation
Introduction
Market Size and Forecast, 2020-2032, (US$ Billion)
Iron and Steel
Introduction
Market Size and Forecast, 2020-2032, (US$ Billion)
Chemical and Petrochemical
Introduction
Market Size and Forecast, 2020-2032, (US$ Billion)
Cement
Introduction
Market Size and Forecast, 2020-2032, (US$ Billion)
Others
Introduction
Market Size and Forecast, 2020-2032, (US$ Billion)
6. Global Carbon Capture and Storage Market, By Service, 2020-2032 (US$ Billion)
Introduction
Market Share Analysis, 2025 and 2032 (%)
Y-o-Y Growth Analysis, 2021-2032
Segment Trends
Capture
Introduction
Market Size and Forecast, 2020-2032, (US$ Billion)
Transportation
Introduction
Market Size and Forecast, 2020-2032, (US$ Billion)
Utilization
Introduction
Market Size and Forecast, 2020-2032, (US$ Billion)
Storage
Introduction
7. Global Carbon Capture and Storage Market, By Region, 2020-2032 (US$ Billion)
Introduction
Market Share Analysis, By Region, 2025 and 2032 (%)
Y-o-Y Growth Analysis, 2021-2032
North America
Regional Trends
Market Size and Forecast, By Technology, 2020-2032 (US$ Billion)
Market Size and Forecast, By Application, 2020-2032 (US$ Billion)
Market Size and Forecast, By Service, 2020-2032 (US$ Billion)
Market Share Analysis, By Country, 2020 and 2032 (%)
U.S.
Canada
Europe
Regional Trends
Market Size and Forecast, By Technology, 2020-2032 (US$ Billion)
Market Size and Forecast, By Application, 2020-2032 (US$ Billion)
Market Size and Forecast, By Service, 2020-2032 (US$ Billion)
Market Share Analysis, By Country, 2020 and 2032 (%)
U.K.
Germany
Italy
France
Russia
Rest of Europe
Asia Pacific
Regional Trends
Market Size and Forecast, By Technology, 2020-2032 (US$ Billion)
Market Size and Forecast, By Application, 2020-2032 (US$ Billion)
Market Size and Forecast, By Service, 2020-2032 (US$ Billion)
Market Share Analysis, By Country, 2020 and 2032 (%)
China
India
ASEAN
Australia
South Korea
Japan
Rest of Asia Pacific
Latin America
Regional Trends
Market Size and Forecast, By Technology, 2020-2032 (US$ Billion)
Market Size and Forecast, By Application, 2020-2032 (US$ Billion)
Market Size and Forecast, By Service, 2020-2032 (US$ Billion)
Market Share Analysis, By Country, 2020 and 2032 (%)
Brazil
Argentina
Mexico
Rest of Latin America
Middle East & Africa
Regional Trends
Market Size and Forecast, By Technology, 2020-2032 (US$ Billion)
Market Size and Forecast, By Application, 2020-2032 (US$ Billion)
Market Size and Forecast, By Service, 2020-2032 (US$ Billion)
Market Share Analysis, By Country, 2020 and 2032 (%)