Plant Phenotyping Market, By Type, By Application, By Geography
상품코드:1671955
리서치사:Coherent Market Insights
발행일:2025년 02월
페이지 정보:영문
라이선스 & 가격 (부가세 별도)
ㅁ Add-on 가능: 고객의 요청에 따라 일정한 범위 내에서 Customization이 가능합니다. 자세한 사항은 문의해 주시기 바랍니다.
한글목차
식물 페노타이핑 세계 시장은 2025년에 3억 3,920만 달러로 추정되며, 2032년까지 7억 7,890만 달러에 달할 것으로 예측되며, 2025-2032년 CAGR은 12.6%로 성장할 전망입니다.
리포트 범위
리포트 상세
기준연도
2024
2025년 시장 규모
3억 3,920만 달러
실적 데이터
2020-2024년
예측 기간
2025-2032년
예측 기간 : 2025-2032년 CAGR :
12.60%
2032년 가치 예측
7억 7,890만 달러
도표. 식물 페노타이핑 시장 점유율(%), 2025년 지역별
식물 표현형 분석은 현장 또는 통제된 환경 조건에서 식물의 표현형 형질을 모니터링하고 정량화합니다. 이를 통해 식물의 크기, 색상, 형태 등 여러 매개변수를 신속하게 분석하여 생리적 및 생화학적 지식을 얻을 수 있습니다. 센서 기술, 자동화 및 데이터 분석의 발전은 최근 수년간 식물 표현형 분석에 혁명을 일으켰습니다. 연구자들은 고속 처리량 기술을 통해 단시간에 수백에서 수천 개의 식물을 평가하고 표현형 특성과 식물 유전자형을 연결할 수 있게 되었습니다. 이를 통해 식물 육종 속도를 높이고, 더 높은 수확량, 생물학적 및 생물학적 스트레스에 대한 내성을 가진 우수한 작물 품종을 개발할 수 있게 되었습니다.
시장 역학:
식물 표현형 분석 시장은 증가하는 세계 인구를 유지하기 위해 작물 생산량을 늘려야 할 필요성에 의해 주도되고 있습니다. 페노타이핑은 기후 변화에 강하고 수확량이 많은 종자 품종을 개발하는 데 도움이 됩니다. 자동화된 페노타이핑 솔루션의 채택은 수작업에 비해 대규모 생식체 풀을 신속하고 객관적으로 처리할 수 있다는 장점으로 인해 확대되고 있습니다. 그러나 페노타이핑 플랫폼의 설치 비용과 유지보수 비용이 높기 때문에 보급에 한계가 있습니다. 식량안보를 확보하기 위한 정부 및 종자회사들의 연구개발 투자 증가는 큰 비즈니스 기회를 가져다 줄 것입니다. 2차 형질 평가 및 연관성 매핑 연구에서 페노타이핑의 범위가 확대되면 시장 성장이 더욱 촉진될 것입니다. 데이터 통합 및 관리 문제를 해결해야 합니다.
본 조사의 주요 특징
세계의 식물 표현형 분석(Plant Phenotyping) 시장을 상세하게 분석하여 2024년을 기준 연도로 하여 예측 기간(2025-2032년) 시장 규모와 연평균 성장률(CAGR)을 조사 분석하여 전해드립니다.
또한 다양한 부문에 걸친 잠재적 매출 기회를 밝히고, 이 시장의 매력적인 투자 제안 매트릭스를 설명합니다.
또한 시장 성장 촉진요인, 억제요인, 기회, 신제품 출시 및 승인, 시장 동향, 지역별 전망, 주요 기업의 경쟁 전략 등에 대한 중요한 인사이트를 제공합니다.
이 보고서는 기업 하이라이트, 제품 포트폴리오, 주요 하이라이트, 성과, 전략 등의 매개 변수를 기반으로 세계 플랜트 페노타이핑 시장의 주요 기업을 프로파일링합니다.
이 보고서의 인사이트를 통해 마케팅 담당자와 기업 경영진은 향후 제품 출시, 유형 업그레이드, 시장 확대, 마케팅 전술에 대한 정보에 입각한 의사결정을 내릴 수 있습니다.
이 보고서는 투자자, 공급업체, 제품 제조업체, 유통업체, 신규 시장 진출기업, 재무 분석가 등 업계의 다양한 이해관계자를 대상으로 합니다.
이해관계자들은 세계 식물 표현형 분석 시장 분석에 사용되는 다양한 전략 매트릭스를 통해 의사결정을 용이하게 할 수 있습니다.
목차
제1장 조사의 목적과 전제조건
조사 목적
전제조건
약어
제2장 시장 전망
리포트 설명
시장의 정의와 범위
개요
제3장 시장 역학, 규제, 동향 분석
시장 역학
촉진요인
억제요인
PEST 분석
PORTER Five Forces 분석
시장 기회
규제 시나리오
업계 동향
합병과 인수
제4장 세계의 식물 페노타이핑 시장 - 코로나바이러스(COVID-19) 팬데믹의 영향
세계의 식물 페노타이핑 시장에 영향을 미치는 요인
영향 분석
제5장 세계의 식물 페노타이핑 시장, 유형별, 2020-2032년
장비
센서
소프트웨어
기타
제6장 세계의 식물 페노타이핑 시장, 용도별, 2020-2032년
High Throughput Screening
특성 식별
광합성 능력
형태와 성장 평가
기타
제7장 세계의 식물 페노타이핑 시장, 지역별, 2020-2032년
북미
라틴아메리카
유럽
아시아태평양
중동 및 아프리카
제8장 경쟁 구도
시장 점유율 분석
기업 개요
BASF SE
Phenospex
WIWAM
Lemnatec Corporation
Plant-DiTech
Hiphen
Delta-T Devices Ltd.
Phenomix
Keygene
Qubit Systems
WPS B.V.
Photon Systems Instruments
Vienna Biocenter
Heinz Walz Gmbh
CropDesign
Rothamsted Research
제9장 애널리스트의 권장사항
제10장 섹션
참고 문헌
조사 방법
KSA
영문 목차
영문목차
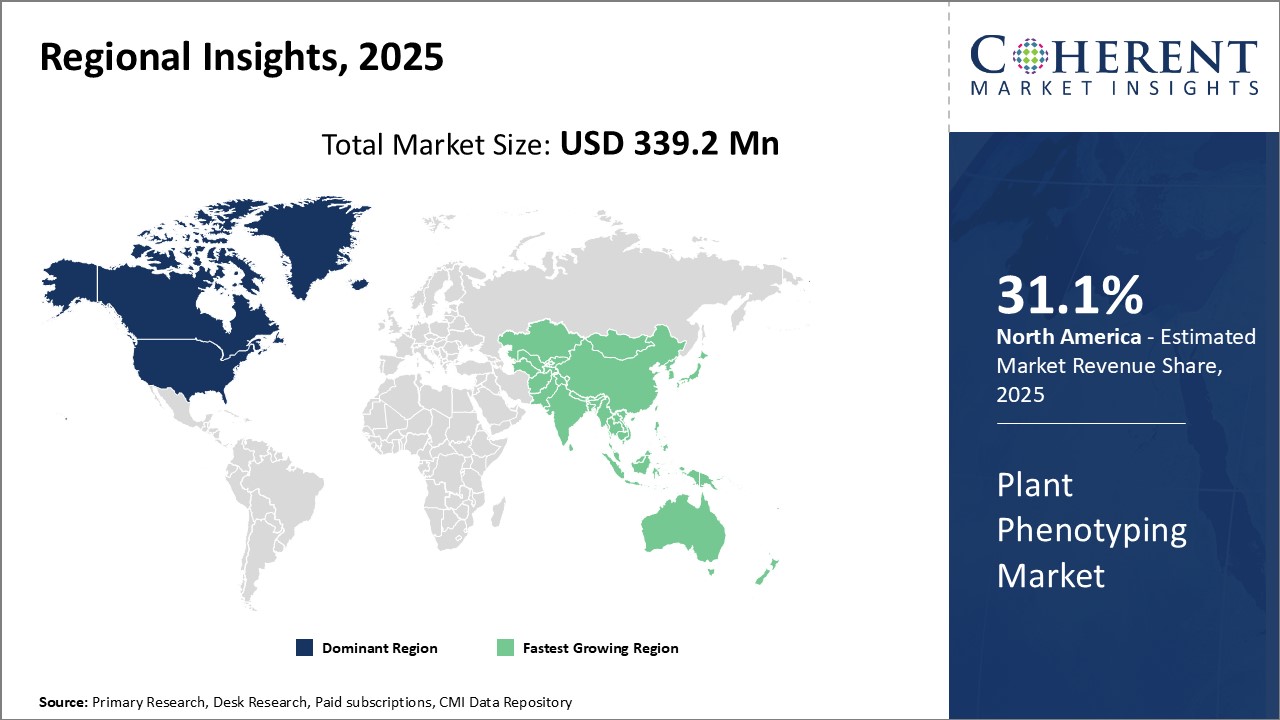
Global Plant Phenotyping Market is estimated to be valued at USD 339.2 Mn in 2025 and is expected to reach USD 778.9 Mn by 2032, growing at a compound annual growth rate (CAGR) of 12.6% from 2025 to 2032.
Report Coverage
Report Details
Base Year:
2024
Market Size in 2025:
USD 339.2 Mn
Historical Data for:
2020 To 2024
Forecast Period:
2025 To 2032
Forecast Period 2025 to 2032 CAGR:
12.60%
2032 Value Projection:
USD 778.9 Mn
Figure. Plant Phenotyping Market Share (%), By Region 2025
Plant phenotyping involves monitoring and quantifying phenotypic traits of plants under field or controlled environment conditions. It allows for the rapid analysis of multiple parameters including plant size, color, and morphology to gain physiological and biochemical insights. Advancements in sensor technologies, automation, and data analysis have revolutionized plant phenotyping in recent years. High throughput techniques are enabling researchers to assess hundreds to thousands of plants in a short time span and link phenotypic characteristics with plant genotypes. This is speeding up plant breeding and helping develop superior crop varieties with higher yields, resistance to biotic and abiotic stresses.
Market Dynamics:
The plant phenotyping market is driven by the need to boost crop production to sustain the rising global population. Phenotyping aids in developing climate-resilient and higher yielding seed varieties. The adoption of automated phenotyping solutions is growing due to their advantages of processing large germplasm pools rapidly and objectively compared to manual methods. However, high installation and maintenance costs of phenotyping platforms restrict broader adoption. Growing R&D investments by governments and seed companies to ensure food security presents major opportunities. Increasing scope of phenotyping in secondary traits evaluation and association mapping studies will further propel the market growth. Data consolidation and management challenges need to be addressed.
Key Features of the Study:
This report provides in-depth analysis of the global plant phenotyping market, and provides market size (US$ Mn) and compound annual growth rate (CAGR%) for the forecast period (2025-2032), considering 2024 as the base year
It elucidates potential revenue opportunities across different segments and explains attractive investment proposition matrices for this market
This study also provides key insights about market drivers, restraints, opportunities, new product launches or approval, market trends, regional outlook, and competitive strategies adopted by key players
It profiles key players in the global plant phenotyping market based on the following parameters - company highlights, products portfolio, key highlights, financial performance, and strategies
Key companies covered as a part of this study include BASF SE, Phenospex, WIWAM, Lemnatec Corporation, Plant-DiTech, Hiphen, Delta-T Devices Ltd., Phenomix, Keygene, Qubit Systems, WPS B.V., Photon Systems Instruments, Vienna Biocenter, Heinz Walz Gmbh, CropDesign, and Rothamsted Research
Insights from this report would allow marketers and the management authorities of the companies to make informed decisions regarding their future product launches, type up-gradation, market expansion, and marketing tactics
The global plant phenotyping market report caters to various stakeholders in this industry including investors, suppliers, product manufacturers, distributors, new entrants, and financial analysts
Stakeholders would have ease in decision-making through various strategy matrices used in analyzing the global plant phenotyping market
Detailed Segmentation-
By Type:
Equipment
Sensors
Software
Others
By Application:
High-throughput screening
Trait identification
Photosynthetic performance
Morphology and growth assessment
Others
By Region:
North America
Europe
Asia Pacific
Latin America
Middle East & Africa
Company Profiles:
BASF SE
Phenospex
WIWAM
Lemnatec Corporation
Plant-DiTech
Hiphen
Delta-T Devices Ltd.
Phenomix
Keygene
Qubit Systems
WPS B.V.
Photon Systems Instruments
Vienna Biocenter
Heinz Walz Gmbh
CropDesign
Rothamsted Research
Table of Contents
1. Research Objectives and Assumptions
Research Objectives
Assumptions
Abbreviations
2. Market Purview
Report Description
Market Definition and Scope
Executive Summary
Market Snippet, By Type
Market Snippet, By Application
Market Snippet, By Region
3. Market Dynamics, Regulations, and Trends Analysis
Market Dynamics
Drivers
Restraints
PEST Analysis
PORTER's Five Forces Analysis
Market Opportunities
Regulatory Scenario
Industry Trend
Mergers and Acquisitions
4. Global Plant Phenotyping Market - Impact of Coronavirus (COVID-19) Pandemic
Overview
Factors Affecting the Global Plant Phenotyping Market
Impact Analysis
5. Global Plant Phenotyping Market, By Type, 2020-2032, (US$ Mn)
Introduction
Market Share Analysis, 2025, 2028 and 2032 (%)
Y-o-Y Growth Analysis, 2021 - 2032
Segment Trends
Equipment
Introduction
Market Size and Forecast, and Y-o-Y Growth, 2020 - 2032, (US$ Mn)
Segment Trends
Sensors
Introduction
Market Size and Forecast, and Y-o-Y Growth, 2020 - 2032, (US$ Mn)
Segment Trends
Software
Introduction
Market Size and Forecast, and Y-o-Y Growth, 2020 - 2032, (US$ Mn)
Segment Trends
Others
Introduction
Market Size and Forecast, and Y-o-Y Growth, 2020 - 2032, (US$ Mn)
Segment Trends
6. Global Plant Phenotyping Market, By Application, 2020-2032, (US$ Mn)
Introduction
Market Share Analysis, 2025, 2028 and 2032 (%)
Y-o-Y Growth Analysis, 2021 - 2032
Segment Trends
High-throughput screening
Introduction
Market Size and Forecast, and Y-o-Y Growth, 2020 - 2032, (US$ Mn)
Segment Trends
Trait identification
Introduction
Market Size and Forecast, and Y-o-Y Growth, 2020 - 2032, (US$ Mn)
Segment Trends
Photosynthetic performance
Introduction
Market Size and Forecast, and Y-o-Y Growth, 2020 - 2032, (US$ Mn)
Segment Trends
Morphology and growth assessment
Introduction
Market Size and Forecast, and Y-o-Y Growth, 2020 - 2032, (US$ Mn)
Segment Trends
Others
Introduction
Market Size and Forecast, and Y-o-Y Growth, 2020 - 2032, (US$ Mn)
Segment Trends
7. Global Plant Phenotyping Market, By Region, 2020-2032, (US$ Mn)
Introduction
Market Share Analysis, By Region, 2025, 2028 and 2032 (%)
Y-o-Y Growth Analysis, For Region, 2021-2032
North America
Introduction
Market Size and Forecast, By Type, 2020 - 2032, (US$ Mn)
Market Size and Forecast, By Application, 2020 - 2032, (US$ Mn)
Market Size and Forecast, By Country, 2020 - 2032, (US$ Mn)
U.S.
Canada
Latin America
Introduction
Market Size and Forecast, By Type, 2020 - 2032, (US$ Mn))
Market Size and Forecast, By Application, 2020 - 2032, (US$ Mn)
Market Size and Forecast, By Country, 2020 - 2032, (US$ Mn)
Brazil
Argentina
Mexico
Rest of Latin America
Europe
Introduction
Market Size and Forecast, By Type, 2020 - 2032, (US$ Mn)
Market Size and Forecast, By Application, 2020 - 2032, (US$ Mn)
Market Size and Forecast, By Country, 2020 - 2032, (US$ Mn)
U.K.
Germany
Italy
France
Spain
Russia
Rest of Europe
Asia Pacific
Introduction
Market Size and Forecast, By Type, 2020 - 2032, (US$ Mn)
Market Size and Forecast, By Application, 2020 - 2032, (US$ Mn)
Market Size and Forecast, By Country, 2020 - 2032, (US$ Mn)
China
India
Japan
ASEAN
Australia
South Korea
Rest of Asia Pacific
Middle East & Africa
Introduction
Market Size and Forecast, By Type, 2020 - 2032, (US$ Mn)
Market Size and Forecast, By Application, 2020 - 2032 (US$ Mn)
Market Size and Forecast, By Country, 2020 - 2032, (US$ Mn)