Global Electroretinogram Market, By Type, By Product, By Application, By Disease Indication, By End User, By Geography
상품코드:1705776
리서치사:Coherent Market Insights
발행일:2025년 03월
페이지 정보:영문
라이선스 & 가격 (부가세 별도)
ㅁ Add-on 가능: 고객의 요청에 따라 일정한 범위 내에서 Customization이 가능합니다. 자세한 사항은 문의해 주시기 바랍니다.
한글목차
세계의 망막전도 시장은 2025년에 4,880만 달러에 달하고, 2032년에는 9,150만 달러에 이를 것으로 예측되고, 2025년부터 2032년까지의 CAGR은 9.4%를 나타낼 것으로 전망됩니다.
보고 범위
보고서 세부정보
기준 연도
2024년
시장 규모(2025년)
4,880만 달러
실적 데이터
2020-2024년
예측 기간
2025-2032년
예측 기간 : 2025-2032년 CAGR :
9.40%
가치 예측(2032년)
9,150만 달러
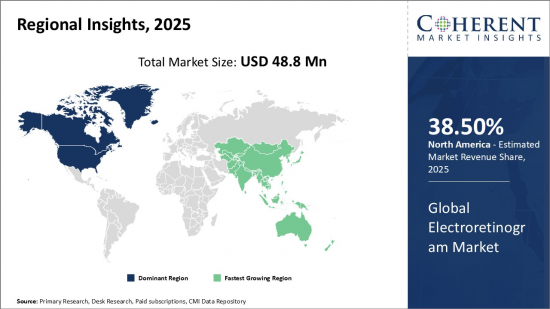
그림. 세계의 망막전도 시장 점유율(%), 지역별(2025년)
망막전도는 망막의 건강과 기능을 평가하기 위해 사용되는 진단용 의료검사입니다. 망막전도(ERG)는 망막의 집단 전기반응을 측정하고 망막 색소 변성증 등의 질환과 관련된 망막의 이상을 검출하는 데 도움이 됩니다.
시장 역학 :
세계의 망막전도 시장은 노화에 따른 망막 질환에 걸리기 쉬운 노년 인구 증가, 당뇨병 망막증의 이환율의 상승, 안과 의료에 대한 의식의 높아짐, 다초점 망막전도를 포함한 기술의 진보에 의해 견인되고 있습니다. 그러나, 많은 신흥국에서는 타쿠는 억제될 가능성이 있습니다. 신흥 경제 제국은 급속한 경제 발전과 헬스 케어 인프라의 확충을 목격하고 있어 시장 개척자에게 유리한 기회를 제공합니다.
주요 성장 촉진요인은 황반 변성증과 녹내장과 같은 노화와 관련된 망막 질환에 걸리기 쉬운 노인 인구 증가입니다. 중요한 요인은 당뇨병의 합병증인 당뇨병성 망막증의 발병률이 증가하고 있다는 점입니다. 눈 관리에 대한 인식이 높아지고 정기적인 안과 검진의 중요성이 부각되면서 시장이 더욱 활성화되었습니다. 다초점 망막전도를 도입하는 등의 기술의 진보에 의해 ERG 장치의 정밀도와 효율이 향상했습니다.
예를 들어, 2022년 10월 세계보건기구(WHO)가 제공한 데이터에 따르면 2020년에는 60세 이상 인구가 5세 미만 어린이보다 더 많아졌습니다. 60세 이상 인구의 비중은 2020년 100만 명에서 140만 명으로 증가했습니다. 2050년에는 전 세계 60세 이상 인구가 두 배(210만 명)로 늘어날 것입니다. 80세 이상 인구는 2020년에서 2050년 사이에 세 배로 증가하여 4억 2,600만 명에 이를 것으로 예상됩니다.
본 조사의 주요 특징
본 보고서에서는 세계의 망막전도 시장을 상세하게 분석하여 2024년을 기준 연도로 한 예측기간(2025-2032년) 시장 규모 및 연간 평균 성장률(CAGR%)을 제공합니다.
또, 다양한 부문에 걸친 잠재적인 수익 기회를 밝혀, 이 시장의 매력적인 투자 제안 매트릭스에 대해서 해설했습니다.
또한 시장 성장 촉진요인, 성장 억제요인, 기회, 신제품 발매 및 승인, 시장 동향, 지역별 전망, 주요 기업이 채용하는 경쟁 전략 등에 관한 주요 인사이트도 제공합니다.
기업 하이라이트, 제품 포트폴리오, 주요 하이라이트, 재무 실적, 전략 등의 파라미터에 근거해, 세계의 망막전도 시장에 있어서의 주요 기업 프로파일을 제공합니다.
이 보고서의 인사이트는 마케팅 담당자와 기업 경영진이 미래의 제품 출시, 유형 업그레이드, 시장 확대, 마케팅 전술에 대한 정보를 바탕으로 의사 결정을 할 수 있게 합니다.
세계의 망막전도 시장 보고서는 투자자, 공급업체, 제품 제조업체, 유통업체, 신규 참가자, 재무 분석가 등 이 업계의 다양한 이해 관계자에 대응하고 있습니다.
이해관계자는 세계의 망막전도 시장 분석에 사용되는 다양한 전략 매트릭스를 통해 의사결정을 용이하게 할 수 있습니다.
목차
제1장 조사의 목적과 전제조건
조사 목적
전제조건
약어
제2장 시장 전망
보고서 설명
시장 정의와 범위
주요 요약
일관된 기회 맵(COM)
제3장 시장 역학, 규제, 동향 분석
시장 역학
성장 촉진요인
성장 억제요인
시장 기회
주요 하이라이트
규제 시나리오
최근 동향
제품 출시/승인
PEST 분석
PORTER 분석
합병, 인수 및 협업
제4장 세계의 망막전도 시장 - COVID-19 팬데믹의 영향
COVID-19 역학
공급측과 수요측의 분석
경제에 미치는 영향
제5장 세계의 망막전도 시장, 유형별(2020-2032년)
전장 망막전도(ffERG)
다초점 망막전도(mfERG)
패턴 망막전도(PERG)
기타
제6장 세계의 망막전도 시장, 제품별(2020-2032년)
핸드헬드
탁상
제7장 세계의 망막전도 시장, 용도별, 2020-2032년
임상 진단
연구
제8장 세계의 망막전도 시장, 질환별(2020-2032년)
당뇨병성 망막증
망막 색소 침착증
콘로드 이영양증
기타
제9장 세계의 망막전도 시장, 최종 사용자별(2020-2032년)
병원
안과 클리닉
학술 및 연구기관
기타
제10장 세계의 망막전도 시장, 지역별(2020-2032년)
북미
유럽
아시아태평양
라틴아메리카
중동
아프리카
제11장 경쟁 구도
기업 프로파일
Cadwell Industries, Inc.
Diagnosys LLC.
LKC Technologies, Inc.
Diopsys, Inc.
Konan Medical USA, Inc.
Electro-Diagnostic Imaging, Inc.
IT
Metrovision
Roland-consult
Neurosoft
Ocular Instruments
Haag-Streit Group
Opto-Medic Co Pte Ltd
Stereo Optical
M&S Technologies
제12장 섹션
참고문헌
조사 방법
출판사에 대해
KTH
영문 목차
영문목차
Global Electroretinogram Market is estimated to be valued at USD 48.8 Mn in 2025 and is expected to reach USD 91.5 Mn by 2032, growing at a compound annual growth rate (CAGR) of 9.4% from 2025 to 2032.
Report Coverage
Report Details
Base Year:
2024
Market Size in 2025:
USD 48.8 Mn
Historical Data for:
2020 To 2024
Forecast Period:
2025 To 2032
Forecast Period 2025 to 2032 CAGR:
9.40%
2032 Value Projection:
USD 91.5 Mn
Figure. Global Electroretinogram Market Share (%), By Region 2025
Electroretinography is a diagnostic medical test that is used to evaluate the health and function of the retina. It provides objective measurements of the retina's electrical activity by recording how it responds to light stimulus. The test involves placing electrodes on the surface of the eye and the scalp of the patient. A light source is then used to illuminate the retina while recording any electrical responses. The electroretinogram or electroretinogram (ERG) measures the mass electric response of the retina and can help detect retinal abnormalities that are associated with diseases like retinitis pigmentosa. Rising prevalence of retinal disorders worldwide is anticipated to drive increased reliance on ERG for improved diagnosis and management of ocular conditions.
Market Dynamics:
Global electroretinogram market is driven by the growing geriatric population prone to age-related retinal diseases, rising incidence of diabetic retinopathy, growing awareness about eye care, and technological advancements incorporating and multifocal electroretinography. However, the market growth can be restrained by the high cost of electroretinogram devices and non-availability of skilled professionals in many developing regions. Emerging economies offer lucrative opportunities for market players as they witness rapid economic development and healthcare infrastructure expansion. Manufacturers investing in research and development (R&D) of portable devices for point-of-care (POC) testing can also open up opportunities.
A primary driver is the increasing geriatric population, which is more susceptible to age-related retinal diseases such as macular degeneration and glaucoma. As the number of elderly individuals rises globally, the demand for ERG for the diagnosis and monitoring of these conditions also increases. Another significant factor is the rising incidence of diabetic retinopathy, a complication of diabetes that affects the eyes. Growing prevalence of diabetes worldwide has led to an increase in demand for early detection and treatment of eye-related complications, thereby propelling the use of ERG devices. Heightened awareness about eye care and the importance of regular eye examinations has further stimulated the market. Public health initiatives and educational campaigns about eye health have encouraged more people to seek comprehensive eye examinations, which often include ERG testing. Technological advancements, such as the incorporation of multifocal electroretinography, have improved the accuracy and efficiency of ERG devices. These innovations have expanded the applications of ERG in diagnosing and treating a variety of retinal conditions, thus making it a valuable tool for ophthalmologists.
For instance, in October 2022, according to data provided by the World Health Organization (WHO), in 2020, the number of people aged 60 years and older outnumbered children younger than 5 years. Between 2015 and 2050, the proportion of the world's population over 60 years will nearly double from 12% to 22%. The share of the population aged 60 years and over will increase from 1 million in 2020 to 1.4 million. By 2050, the world's population of people aged 60 years and olders will double (2.1 million). The number of persons aged 80 years or older is expected to triple between 2020 and 2050 to reach 426 million.
Key features of the study:
This report provides in-depth analysis of the global electroretinogram market, and provides market size (US$ Mn) and compound annual growth rate (CAGR%) for the forecast period (2025-2032), considering 2024 as the base year.
It elucidates potential revenue opportunities across different segments and explains attractive investment proposition matrices for this market.
This study also provides key insights about market drivers, restraints, opportunities, new product launches or approval, market trends, regional outlook, and competitive strategies adopted by key players.
It profiles key players in the global electroretinogram market based on the following parameters company highlights, products portfolio, key highlights, financial performance, and strategies.
Key companies covered as a part of this study include Cadwell Industries Inc, Diagnosys LLC, LKC Technologies, Inc., Diopsys, Inc., Konan Medical USA, Inc., and Electro-Diagnostic Imaging, Inc. CSOITALIA.IT, Metrovision, Roland-consult, Neurosoft, Ocular Instruments, Haag-Streit Group, Opto-Medic Co Pte Ltd, Stereo Optical, and M&S Technologies.
Insights from this report would allow marketers and the management authorities of the companies to make informed decisions regarding their future product launches, type up-gradation, market expansion, and marketing tactics.
Global electroretinogram market report caters to various stakeholders in this industry including investors, suppliers, product manufacturers, distributors, new entrants, and financial analysts.
Stakeholders would have ease in decision-making through various strategy matrices used in analyzing the global electroretinogram market.
Detailed Segmentation:
Global Electroretinogram Market, By Type:
Full-field Electroretinography (ffERG)
Multi-focal Electroretinography (mfERG)
Pattern Electroretinography (PERG)
Others
Global Electroretinogram Market, By Product:
Handheld
Table top
Global Electroretinogram Market, By Application:
Clinical Diagnostic
Research
Global Electroretinogram Market, By Disease Indication:
Diabetic Retinopathy
Retinitis pigmentosa
Cone-rod Dystrophy
Others
Global Electroretinogram Market, By End User:
Hospitals
Ophthalmic Clinics
Academic &Research Institutes
Others
Global Electroretinogram Market, By Region:
North America
Latin America
Europe
Asia Pacific
Middle East
Africa
Company Profiles
Cadwell Industries, Inc.
Diagnosys LLC.
LKC Technologies, Inc.
Diopsys, Inc.
Konan Medical USA, Inc.
Electro-Diagnostic Imaging, Inc.
IT
Metrovision
Roland-consult
Neurosoft
Ocular Instruments
Haag-Streit Group
Opto-Medic Co Pte Ltd
Stereo Optical
M&S Technologies
Table of Contents
1. Research Objectives and Assumptions
Research Objectives
Assumptions
Abbreviations
2. Market Purview
Report Description
Market Definition and Scope
Executive Summary
Electroretinogram Market, By Type
Electroretinogram Market, By Product
Electroretinogram Market, By Application
Electroretinogram Market, By Disease Indication
Electroretinogram Market, By End User
Electroretinogram Market, By Region
Coherent Opportunity Map (COM)
3. Market Dynamics, Regulations, and Trends Analysis
Market Dynamics
Drivers
Restraints
Market Opportunity
Key Highlights
Regulatory Scenario
Recent Trends
Product Launches/Approvals
PEST Analysis
PORTER's Analysis
Mergers, Acquisitions,, and Collaborations
4. Global Electroretinogram Market- Impact of Coronavirus (COVID-19) Pandemic
COVID-19 Epidemiology
Supply Side and Demand Side Analysis
Economic Impact
5. Global Electroretinogram Market, By Type, 2020-2032, (US$ Mn)
Introduction
Market Share Analysis, 2025 and 2032 (%)
Y-o-Y Growth Analysis, 2021 - 2032
Segment Trends
Full-field Electroretinography (ffERG)
Introduction
Market Size and Forecast, and Y-o-Y Growth, 2020-2032,(US$ Mn)
Multi-focal Electroretinography (mfERG)
Introduction
Market Size and Forecast, and Y-o-Y Growth, 2020-2032,(US$ Mn)
Pattern Electroretinography (PERG)
Introduction
Market Size and Forecast, and Y-o-Y Growth, 2020-2032,(US$ Mn)
Others
Introduction
Market Size and Forecast, and Y-o-Y Growth, 2020-2032,(US$ Mn)
6. Global Electroretinogram Market, By Product, 2020-2032, (US$ Mn)
Introduction
Market Share Analysis, 2025 and 2032 (%)
Y-o-Y Growth Analysis, 2021-2032
Segment Trends
Handheld
Introduction
Market Size and Forecast, and Y-o-Y Growth, 2020-2032,(US$ Mn)
Table top
Introduction
Market Size and Forecast, and Y-o-Y Growth, 2020-2032,(US$ Mn)
7. Global Electroretinogram Market, By Application, 2020-2032, (US$ Mn)
Introduction
Market Share Analysis, 2025 and 2032 (%)
Y-o-Y Growth Analysis, 2021-2032
Segment Trends
Clinical Diagnostic
Introduction
Market Size and Forecast, and Y-o-Y Growth, 2020-2032,(US$ Mn)
Research
Introduction
Market Size and Forecast, and Y-o-Y Growth, 2020-2032,(US$ Mn)
8. Global Electroretinogram Market, By Disease Indication, 2020-2032, (US$ Mn)
Introduction
Market Share Analysis, 2025 and 2032 (%)
Y-o-Y Growth Analysis, 2021-2032
Segment Trends
Diabetic Retinopathy
Introduction
Market Size and Forecast, and Y-o-Y Growth, 2020-2032,(US$ Mn)
Retinitis pigmentosa
Introduction
Market Size and Forecast, and Y-o-Y Growth, 2020-2032,(US$ Mn)
Cone-rod Dystrophy
Introduction
Market Size and Forecast, and Y-o-Y Growth, 2020-2032,(US$ Mn)
Others
Introduction
Market Size and Forecast, and Y-o-Y Growth, 2020-2032,(US$ Mn)
9. Global Electroretinogram Market, By End User, 2020-2032, (US$ Mn)
Introduction
Market Share Analysis, 2025 and 2032 (%)
Y-o-Y Growth Analysis, 2021-2032
Segment Trends
Hospitals
Introduction
Market Size and Forecast, and Y-o-Y Growth, 2020-2032,(US$ Mn)
Ophthalmic Clinics
Introduction
Market Size and Forecast, and Y-o-Y Growth, 2020-2032,(US$ Mn)
Academic &Research Institutes
Introduction
Market Size and Forecast, and Y-o-Y Growth, 2020-2032,(US$ Mn)
Other
Introduction
Market Size and Forecast, and Y-o-Y Growth, 2020-2032,(US$ Mn)
10. Global Electroretinogram Market, By Region, 2020-2032, (US$ Mn)
Introduction
Market Share Analysis, By Region, 2025 and 2032 (%)
Y-o-Y Growth Analysis, For Region, 2021-2032
Country Trends
North America
Introduction
Market Size and Forecast, and Y-o-Y Growth, By Type, 2020-2032,(US$ Mn)
Market Size and Forecast, and Y-o-Y Growth, By Product, 2020-2032,(US$ Mn)
Market Size and Forecast, and Y-o-Y Growth, By Application, 2020-2032,(US$ Mn)
Market Size and Forecast, and Y-o-Y Growth, By Disease Indication, 2020-2032,(US$ Mn)
Market Size and Forecast, and Y-o-Y Growth, By End User, 2020-2032,(US$ Mn)
Market Size and Forecast, and Y-o-Y Growth, By Country, 2020-2032,(US$ Mn)
U.S.
Canada
Europe
Introduction
Market Size and Forecast, and Y-o-Y Growth, By Type, 2020-2032,(US$ Mn)
Market Size and Forecast, and Y-o-Y Growth, By Product, 2020-2032,(US$ Mn)
Market Size and Forecast, and Y-o-Y Growth, By Application, 2020-2032,(US$ Mn)
Market Size and Forecast, and Y-o-Y Growth, By Disease Indication, 2020-2032,(US$ Mn)
Market Size and Forecast, and Y-o-Y Growth, By End User, 2020-2032,(US$ Mn)
Market Size and Forecast, and Y-o-Y Growth, By Country, 2020-2032,(US$ Mn)
U.K.
Germany
Italy
France
Spain
Russia
Rest of Europe
Asia Pacific
Introduction
Market Size and Forecast, and Y-o-Y Growth, By Type, 2020-2032,(US$ Mn)
Market Size and Forecast, and Y-o-Y Growth, By Product, 2020-2032,(US$ Mn)
Market Size and Forecast, and Y-o-Y Growth, By Application, 2020-2032,(US$ Mn)
Market Size and Forecast, and Y-o-Y Growth, By Disease Indication, 2020-2032,(US$ Mn)
Market Size and Forecast, and Y-o-Y Growth, By End User, 2020-2032,(US$ Mn)
Market Size and Forecast, and Y-o-Y Growth, By Country, 2020-2032,(US$ Mn)
China
India
Japan
Australia
South Korea
ASEAN
Rest of Asia Pacific
Latin America
Introduction
Market Size and Forecast, and Y-o-Y Growth, By Type, 2020-2032,(US$ Mn)
Market Size and Forecast, and Y-o-Y Growth, By Product, 2020-2032,(US$ Mn)
Market Size and Forecast, and Y-o-Y Growth, By Application, 2020-2032,(US$ Mn)
Market Size and Forecast, and Y-o-Y Growth, By Disease Indication, 2020-2032,(US$ Mn)
Market Size and Forecast, and Y-o-Y Growth, By End User, 2020-2032,(US$ Mn)
Market Size and Forecast, and Y-o-Y Growth, By Country, 2020-2032,(US$ Mn)
Brazil
Argentina
Mexico
Rest of Latin America
Middle East
Introduction
Market Size and Forecast, and Y-o-Y Growth, By Type, 2020-2032,(US$ Mn)
Market Size and Forecast, and Y-o-Y Growth, By Product, 2020-2032,(US$ Mn)
Market Size and Forecast, and Y-o-Y Growth, By Application, 2020-2032,(US$ Mn)
Market Size and Forecast, and Y-o-Y Growth, By Disease Indication, 2020-2032,(US$ Mn)
Market Size and Forecast, and Y-o-Y Growth, By End User, 2020-2032,(US$ Mn)
Market Size and Forecast, and Y-o-Y Growth, By Country, 2020-2032,(US$ Mn)
GCC Countries
Israel
Rest of Middle East
Africa
Introduction
Market Size and Forecast, and Y-o-Y Growth, By Type, 2020-2032,(US$ Mn)
Market Size and Forecast, and Y-o-Y Growth, By Product, 2020-2032,(US$ Mn)
Market Size and Forecast, and Y-o-Y Growth, By Application, 2020-2032,(US$ Mn)
Market Size and Forecast, and Y-o-Y Growth, By Disease Indication, 2020-2032,(US$ Mn)
Market Size and Forecast, and Y-o-Y Growth, By End User, 2020-2032,(US$ Mn)
Market Size and Forecast, and Y-o-Y Growth, By Country/Region, 2020-2032,(US$ Mn)