Flare Gas Recovery Systems Market, By Capacity, By Application, By Geography
상품코드:1673965
리서치사:Coherent Market Insights
발행일:2025년 02월
페이지 정보:영문
라이선스 & 가격 (부가세 별도)
ㅁ Add-on 가능: 고객의 요청에 따라 일정한 범위 내에서 Customization이 가능합니다. 자세한 사항은 문의해 주시기 바랍니다.
한글목차
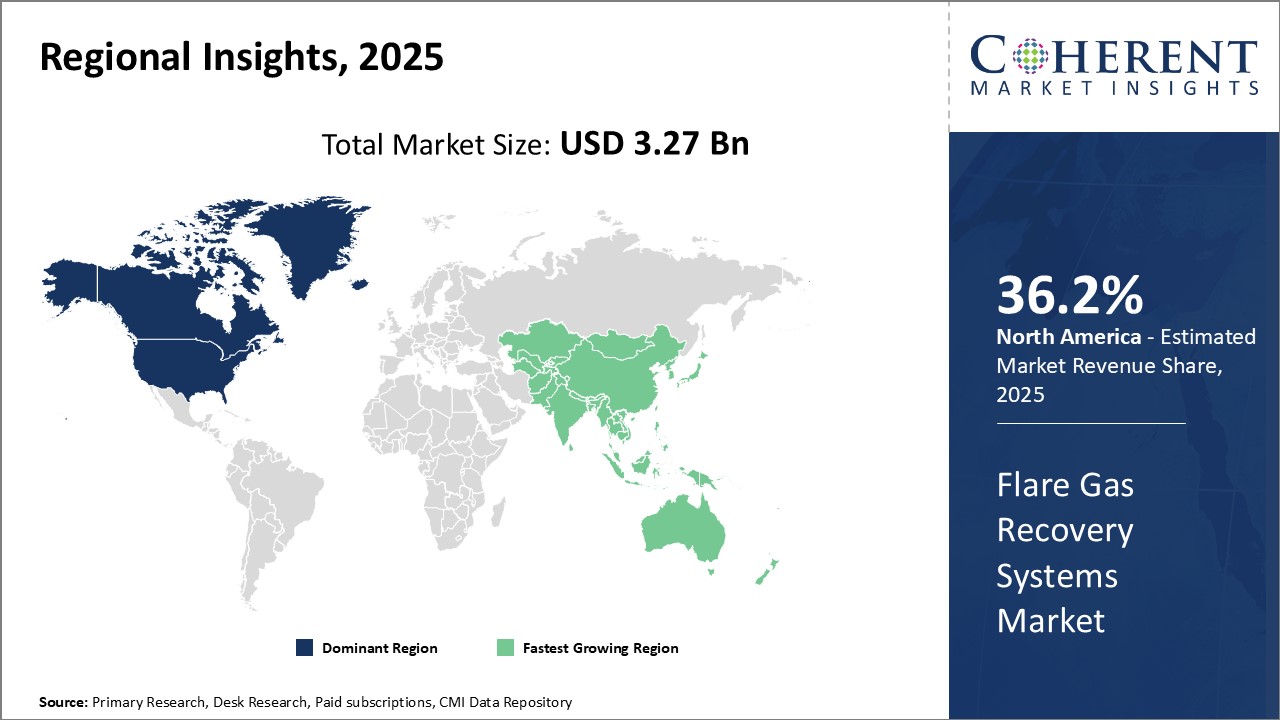
세계의 플레어 가스 회수 시스템 시장은 2025년에 32억 7,000만 달러로 추정되며, 2032년에는 63억 7,000만 달러에 달할 것으로 예측되며, 2025-2032년에 CAGR 10.0%로 성장할 전망입니다.
보고서 범위
보고서 상세 내용
기준연도
2024년
2025년 시장 규모
32억 7,000만 달러
실적 데이터
2020-2024년
예측 기간
2025-2032년
예측 기간 : 2025-2032년 CAGR
10.00%
2032년 금액 예측
63억 7,000만 달러
도표. 2025년 지역별 플레어 가스 회수 시스템 시장 점유율(%)
플레어 가스 회수 시스템은 비의도적 배출 가스를 생산 공정 및 발전 활동에 재사용할 수 있도록 합니다. 전 세계에서 배출 규제가 강화되고 에너지 비용이 상승함에 따라 기업은 효율을 높이고 온실 가스 배출을 억제하기 위해 이러한 시스템을 도입하는 경향이 증가하고 있습니다. 최신 디지털 기술은 플레어 가스 회수 모니터링 및 제어를 개선하고 회수율을 극대화할 수 있게 해줍니다. 지속가능성이 비즈니스의 필수 조건이 되면서 향후 수년간 시장은 매력적인 성장세를 보일 것으로 예상됩니다.
시장 역학
세계 플레어 가스 회수 시스템 시장은 플레어 활동을 억제하는 엄격한 환경 규범과 탄소발자국을 최소화하기 위한 인프라 투자에 의해 주도되고 있습니다. 또한 새로운 수입원을 창출할 수 있는 낭비되는 에너지 회수에 대한 인식이 높아짐에 따라 산업이 성장하고 있습니다. 그러나 높은 초기 설치 비용과 유량이 변동하는 원격지 시설에 대한 회수 시스템 설계의 복잡성은 여전히 폭넓은 채택률을 저해하고 있습니다. 반면, 원격 모니터링 및 예방적 유지보수를 가능하게 하는 디지털 기술의 발전과 셰일 개발로 인한 유전의 부수적 가스 회수는 시장 진출기업에게 유리한 기회를 제공합니다.
본 조사의 주요 특징
세계의 플레어 가스 회수 시스템(Flare Gas Recovery System) 시장에 대해 조사 분석했으며, 2024년을 기준 연도로 하여 예측 기간(2025-2032년) 시장 규모와 연평균 성장률(CAGR%)을 게재하고 있습니다.
또한 다양한 부문에 걸친 잠재적인 매출 성장 기회를 파악하고, 이 시장의 매력적인 투자 제안 매트릭스를 설명합니다.
또한 시장 성장 촉진요인, 억제요인, 기회, 신제품 출시 및 승인, 시장 동향, 지역별 전망, 주요 기업의 경쟁 전략 등에 대한 주요 인사이트를 제공합니다.
이 보고서는 기업 하이라이트, 제품 포트폴리오, 주요 하이라이트, 재무 성과, 전략 등의 매개 변수를 기반으로 세계 플레어 가스 회수 시스템 시장의 주요 업체를 프로파일링합니다.
이 보고서의 인사이트를 통해 마케팅 담당자와 기업 경영진은 향후 제품 출시, 유형 업그레이드, 시장 확대, 마케팅 전술에 대한 정보에 입각한 의사결정을 내릴 수 있습니다.
플레어 가스 회수 시스템 세계 시장 보고서는 투자자, 공급업체, 제품 제조업체, 유통업체, 신규 시장 진출기업, 재무 분석가 등 이 산업의 다양한 이해관계자를 대상으로 합니다.
이해관계자들은 세계 플레어 가스 회수 시스템 시장 분석에 사용되는 다양한 전략 매트릭스를 통해 의사결정을 쉽게 내릴 수 있습니다.
목차
제1장 조사의 목적과 전제조건
조사 목적
전제조건
약어
제2장 시장 전망
리포트 설명
시장의 정의와 범위
개요
COM(Coherent Opportunity Map)
제3장 시장 역학, 규제, 동향 분석
시장 역학
촉진요인
억제요인
PEST 분석
Porter's Five Forces 분석
시장 기회
규제 시나리오
산업 동향
합병과 인수
제4장 세계의 플레어 가스 회수 시스템 시장 - 코로나바이러스(COVID-19) 팬데믹의 영향
서론
세계의 플레어 가스 회수 시스템 시장에 영향을 미치는 요인
영향 분석
제5장 세계의 플레어 가스 회수 시스템 시장, 용량별, 2020-2032년
서론
소용량
중용량
대용량
초대형 용량
제6장 세계의 플레어 가스 회수 시스템 시장, 용도별, 2020-2032년
서론
정유소
화학 공장
가스 처리와 NGL 플랜트
FPSO 플랫폼
저장탱크 벤트 회수
제7장 세계의 플레어 가스 회수 시스템 시장, 지역별, 2020-2032년
서론
북미
라틴아메리카
유럽
아시아태평양
중동 및 아프리카
제8장 경쟁 구도
시장 점유율 분석
기업 개요
Baker Hughes
Gardner Denver
Transvac
Aerzen USA
MPR Industries
Wartsila
Schneider Electric
Siemens
Eaton
Legrand
Mitsubishi Electric Corporation
Rockwell Automation
Hitachi, Ltd.
Honeywell UOP
Cimarron Energy, INC.(Jordan Technologies)
Zeeco, Inc
SoEnergy International
John Zink Hamworthy Combustion
Ramboll Group, Inc.
Srisen Energy Technology Co., Ltd
제9장 애널리스트의 권장사항
운명의 수레바퀴
COM(Coherent Opportunity Map)
제10장 섹션
참고 문헌
조사 방법
KSA
영문 목차
영문목차
Global Flare Gas Recovery Systems Market is estimated to be valued at USD 3.27 Bn in 2025 and is expected to reach USD 6.37 Bn by 2032, growing at a compound annual growth rate (CAGR) of 10.0% from 2025 to 2032.
Report Coverage
Report Details
Base Year:
2024
Market Size in 2025:
USD 3.27 Bn
Historical Data for:
2020 To 2024
Forecast Period:
2025 To 2032
Forecast Period 2025 to 2032 CAGR:
10.00%
2032 Value Projection:
USD 6.37 Bn
Figure. Flare Gas Recovery Systems Market Share (%), By Region 2025
They allow for the recycling of unintentional emissions back into the production process or power generation activities. The growing stringency of emissions regulations worldwide coupled with rising energy costs has prompted companies to increasingly deploy these systems to boost efficiencies and curb greenhouse gas footprints. Modern digital technologies are also enabling improved monitoring and control of flare gas recovery for maximizing recoveries. With sustainability becoming a business imperative, the market is projected to experience attractive growth over the coming years.
Market Dynamics:
The global flare gas recovery systems market is driven by stringent environmental norms curbing flaring activities and investments in infrastructure to minimize carbon footprints. Growing awareness about wasted energy recovery presenting fresh revenue streams is also propelling the industry. However, high upfront costs associated with installation and complexities in designing recovery systems for remote facilities with fluctuating flow rates continue to restrain broader adoption rates. Meanwhile, advancements in digital technologies enabling remote monitoring and preventive maintenance as well as recoveries of associated gas from oil fields unlocked by shale developments present lucrative opportunities for market participants.
Key Features of the Study:
This report provides an in-depth analysis of the global flare gas recovery systems market, and provides market size (US$ Bn) and compound annual growth rate (CAGR%) for the forecast period (2025-2032), considering 2024 as the base year.
It elucidates potential revenue growth opportunities across different segments and explains attractive investment proposition matrices for this market.
This study also provides key insights about market drivers, restraints, opportunities, new product launches or approval, market trends, regional outlook, and competitive strategies adopted by key players.
It profiles key players in the global flare gas recovery systems market based on the following parameters - company highlights, products portfolio, key highlights, financial performance, and strategies.
Key companies covered as a part of this study include Baker Hughes , Gardner Denver , Transvac , Aerzen USA, MPR Industries, Wartsila , Schneider Electric, Siemens, Eaton, Legrand, Mitsubishi Electric Corporation, Rockwell Automation, Hitachi, Ltd., Honeywell UOP, Cimarron Energy, INC.( Jordan Technologies), Zeeco, Inc, SoEnergy International, John Zink Hamworthy Combustion, Ramboll Group, Inc., and Srisen Energy Technology Co., Ltd.
Insights from this report would allow marketers and the management authorities of the companies to make informed decisions regarding their future product launches, type up-gradation, market expansion, and marketing tactics.
The global flare gas recovery systems market report caters to various stakeholders in this industry including investors, suppliers, product manufacturers, distributors, new entrants, and financial analysts.
Stakeholders would have ease in decision-making through various strategy matrices used in analyzing the global flare gas recovery systems market.
Detailed Segmentation-
By Capacity:
Small
Medium
Large
Very Large
By Application:
Petroleum Refineries
Chemical Plants
Gas Treatment and NGL Plants
FPSO Platforms
Storage Tank Vent Recovery
By Region:
North America
Europe
Asia Pacific
Latin America
Middle East & Africa
Company Profiles:
Baker Hughes
Gardner Denver
Transvac
Aerzen USA
MPR Industries
Wartsila
Schneider Electric
Siemens
Eaton
Legrand
Mitsubishi Electric Corporation
Rockwell Automation
Hitachi, Ltd.
Honeywell UOP
Cimarron Energy, INC.( Jordan Technologies)
Zeeco, Inc
SoEnergy International
John Zink Hamworthy Combustion
Ramboll Group, Inc.
Srisen Energy Technology Co., Ltd
Table of Contents
1. Research Objectives and Assumptions
Research Objectives
Assumptions
Abbreviations
2. Market Purview
Report Description
Market Definition and Scope
Executive Summary
Market Snippet, By Capacity
Market Snippet, By Application
Market Snippet, By Region
Coherent Opportunity Map (COM)
3. Market Dynamics, Regulations, and Trends Analysis
Market Dynamics
Drivers
Restraints
PEST Analysis
PORTER's Five Forces Analysis
Market Opportunities
Regulatory Scenario
Industry Trend
Mergers and Acquisitions
4. Global Flare Gas Recovery Systems Market - Impact of Coronavirus (COVID-19) Pandemic
Overview
Factors Affecting the Global Flare Gas Recovery Systems Market
Impact Analysis
5. Global Flare Gas Recovery Systems Market, By Capacity, 2020-2032, (US$ Bn)
Introduction
Market Share Analysis, 2025, 2028 and 2032 (%)
Y-o-Y Growth Analysis, 2021 - 2032
Segment Trends
Small
Market Share Analysis, 2025, 2028 and 2032 (%)
Y-o-Y Growth Analysis, 2021 - 2032
Segment Trends
Medium
Market Share Analysis, 2025, 2028 and 2032 (%)
Y-o-Y Growth Analysis, 2021 - 2032
Segment Trends
Large
Market Share Analysis, 2025, 2028 and 2032 (%)
Y-o-Y Growth Analysis, 2021 - 2032
Segment Trends
Very Large
Market Share Analysis, 2025, 2028 and 2032 (%)
Y-o-Y Growth Analysis, 2021 - 2032
Segment Trends
6. Global Flare Gas Recovery Systems Market, By Application, 2020-2032, (US$ Bn)
Introduction
Market Share Analysis, 2025, 2028 and 2032 (%)
Y-o-Y Growth Analysis, 2021 - 2032
Segment Trends
Petroleum Refineries
Market Share Analysis, 2025, 2028 and 2032 (%)
Y-o-Y Growth Analysis, 2021 - 2032
Segment Trends
Chemical Plants
Market Share Analysis, 2025, 2028 and 2032 (%)
Y-o-Y Growth Analysis, 2021 - 2032
Segment Trends
Gas Treatment and NGL Plants
Market Share Analysis, 2025, 2028 and 2032 (%)
Y-o-Y Growth Analysis, 2021 - 2032
Segment Trends
FPSO Platforms
Market Share Analysis, 2025, 2028 and 2032 (%)
Y-o-Y Growth Analysis, 2021 - 2032
Segment Trends
Storage Tank Vent Recovery
Market Share Analysis, 2025, 2028 and 2032 (%)
Y-o-Y Growth Analysis, 2021 - 2032
Segment Trends
7. Global Flare Gas Recovery Systems Market, By Region, 2020-2032, (US$ Bn)
Introduction
Market Share Analysis, By Region, 2025, 2028 and 2032 (%)
Y-o-Y Growth Analysis, For Region, 2021-2032
North America
Introduction
Market Size and Forecast, By Capacity, 2020 - 2032, (US$ Bn)
Market Size and Forecast, By Application, 2020 - 2032, (US$ Bn)
Market Size and Forecast, By Country, 2020 - 2032, (US$ Bn)
U.S.
Canada
Latin America
Introduction
Market Size and Forecast, By Capacity, 2020 - 2032, (US$ Bn))
Market Size and Forecast, By Application, 2020 - 2032, (US$ Bn)
Market Size and Forecast, By Country, 2020 - 2032, (US$ Bn)
Brazil
Argentina
Mexico
Rest of Latin America
Europe
Introduction
Market Size and Forecast, By Capacity, 2020 - 2032, (US$ Bn)
Market Size and Forecast, By Application, 2020 - 2032, (US$ Bn)
Market Size and Forecast, By Country, 2020 - 2032, (US$ Bn)
U.K.
Germany
Italy
France
Spain
Russia
Rest of Europe
Asia Pacific
Introduction
Market Size and Forecast, By Capacity, 2020 - 2032, (US$ Bn)
Market Size and Forecast, By Application, 2020 - 2032, (US$ Bn)
Market Size and Forecast, By Country, 2020 - 2032, (US$ Bn)
China
India
Japan
ASEAN
Australia
South Korea
Rest of Asia Pacific
Middle East & Africa
Introduction
Market Size and Forecast, By Capacity, 2020 - 2032, (US$ Bn)
Market Size and Forecast, By Application, 2020 - 2032 (US$ Bn)
Market Size and Forecast, By Country, 2020 - 2032, (US$ Bn)